Note
Go to the end to download the full example code.
Empirical cumulative distribution
ecdfplot plots every observation as one step, so unlike a histogram or a
density it involves no bin width and no bandwidth – nothing is smoothed away.
complementary=True plots P(X > x) instead.
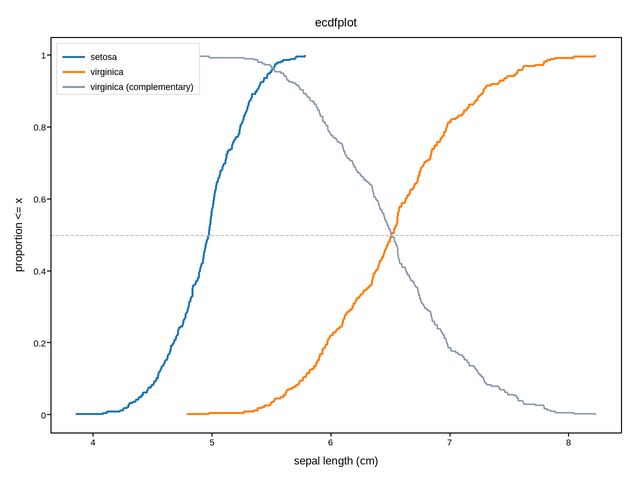
Live figure — pick a tool, then zoom, pan, point-pick or annotate. Nothing is active until a tool is selected.
View this figure’s Vega export ↗ — the raw JSON spec, rendered live by a real Vega engine.
View this figure’s Vega-Lite export ↗ — the raw JSON spec(s), rendered live by a real Vega-Lite engine.
import numpy as np
import plotpress

rng = np.random.default_rng(7)
setosa = rng.normal(5.0, 0.35, 300)
virginica = rng.normal(6.6, 0.64, 300)

fig, ax = plotpress.subplots()
ax.ecdfplot(setosa, linewidth=1.8, label="setosa")
ax.ecdfplot(virginica, linewidth=1.8, label="virginica")
ax.ecdfplot(virginica, color="#8d99ae", linewidth=1.3, complementary=True,
            label="virginica (complementary)")
ax.axhline(0.5, color="#c0c0c0", linewidth=0.9)
ax.set_xlabel("sepal length (cm)")
ax.set_ylabel("proportion <= x")
ax.set_title("ecdfplot")
ax.legend(loc="upper left")
fig.tight_layout()
Total running time of the script: (0 minutes 0.091 seconds)