Note
Go to the end to download the full example code.
Overlapping densities
kdeplot draws a Gaussian kernel-density estimate. Each curve integrates to
one, so shapes stay comparable across groups of different sizes.
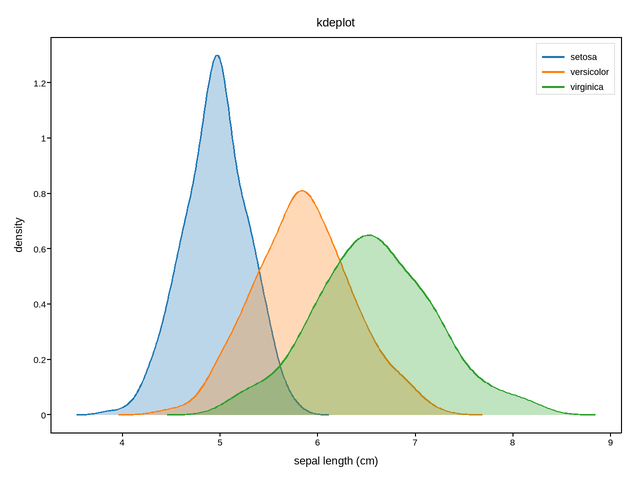
Live figure — pick a tool, then zoom, pan, point-pick or annotate. Nothing is active until a tool is selected.
View this figure’s Vega export ↗ — the raw JSON spec, rendered live by a real Vega engine.
View this figure’s Vega-Lite export ↗ — the raw JSON spec(s), rendered live by a real Vega-Lite engine.
import numpy as np
import plotpress

rng = np.random.default_rng(7)
groups = {
    "setosa": rng.normal(5.0, 0.35, 300),
    "versicolor": rng.normal(5.9, 0.52, 450),
    "virginica": rng.normal(6.6, 0.64, 380),
}

fig, ax = plotpress.subplots()
for name, values in groups.items():
    ax.kdeplot(values, fill=True, label=name)
ax.set_xlabel("sepal length (cm)")
ax.set_ylabel("density")
ax.set_title("kdeplot")
ax.legend()
fig.tight_layout()
Total running time of the script: (0 minutes 0.112 seconds)