Statistical distributions
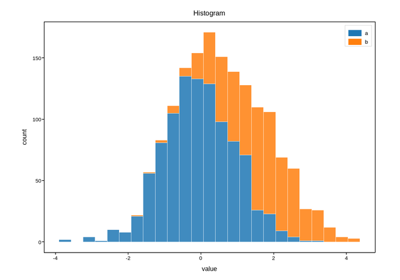
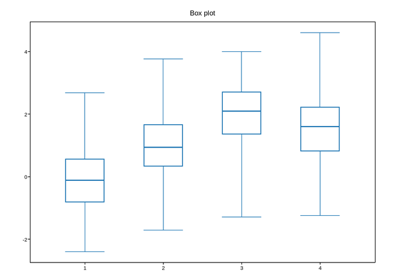
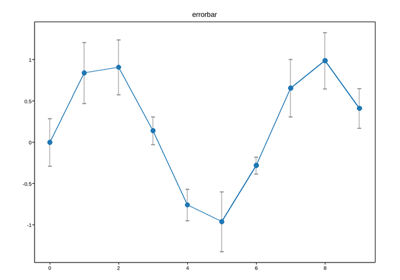
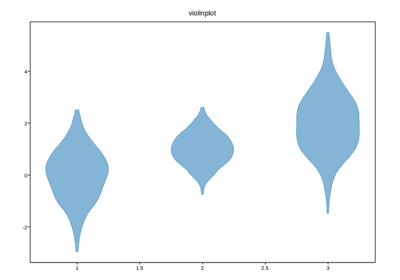
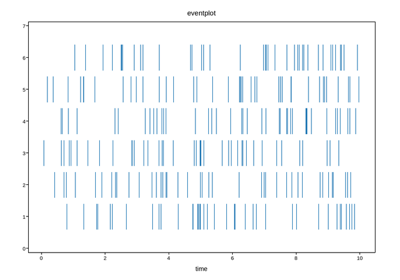
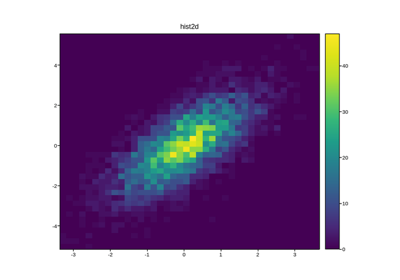
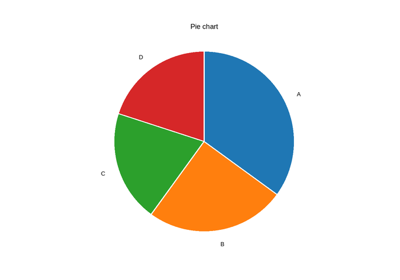
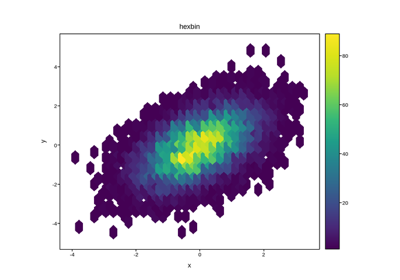
Summarizing a batch of values rather than plotting them one by one: histograms in one and two dimensions, box and violin plots, error bars, event rasters, and a pie chart for simple composition.
Summarizing a batch of values rather than plotting them one by one: histograms in one and two dimensions, box and violin plots, error bars, event rasters, and a pie chart for simple composition.