Note
Go to the end to download the full example code.
Box plot
whis sets how many IQRs past q1/q3 the whiskers reach before a point
counts as a flier (matplotlib’s own default is 1.5; wider here so fewer
of this dataset’s points are flagged).
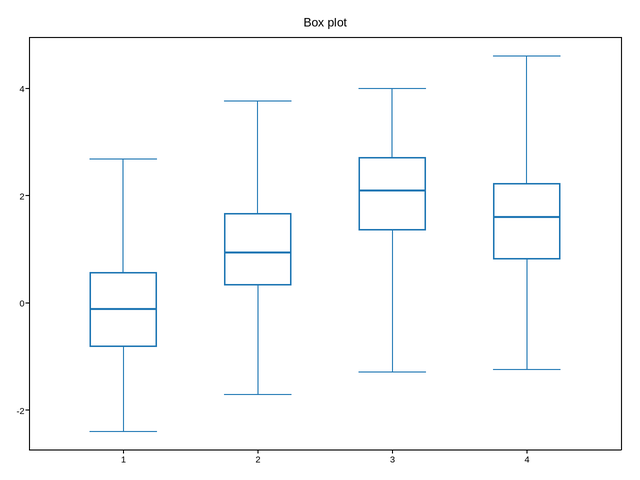
Live figure — pick a tool, then zoom, pan, point-pick or annotate. Nothing is active until a tool is selected.
import numpy as np
import plotpress

rng = np.random.default_rng(5)
data = [rng.normal(loc, 1.0, 200) for loc in (0, 1, 2, 1.5)]
fig, ax = plotpress.subplots()
ax.boxplot(data, whis=2.5)
ax.set_title("Box plot")
fig.tight_layout()
Total running time of the script: (0 minutes 0.078 seconds)