Note
Go to the end to download the full example code.
Histogram
Two datasets sharing one set of bins, stacked bottom-to-top
(stacked=True) – each bar’s own height still reads directly off the
axis, which overlaid (the default) it wouldn’t once they cover each other.
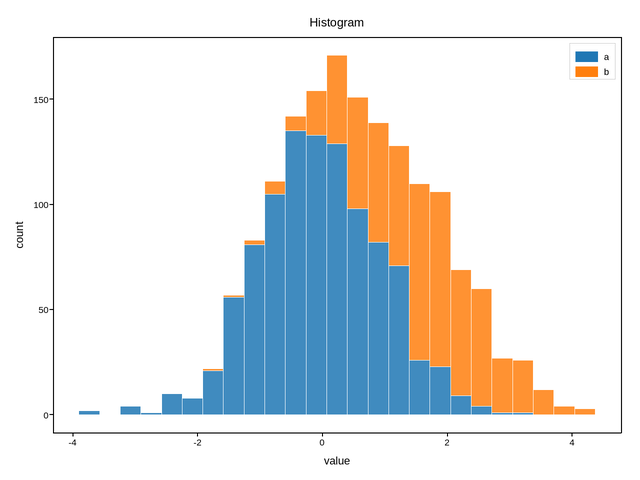
Live figure — pick a tool, then zoom, pan, point-pick or annotate. Nothing is active until a tool is selected.
View this figure’s Vega export ↗ — the raw JSON spec, rendered live by a real Vega engine.
View this figure’s Vega-Lite export ↗ — the raw JSON spec(s), rendered live by a real Vega-Lite engine.
import numpy as np
import plotpress

rng = np.random.default_rng(0)
fig, ax = plotpress.subplots()
ax.hist([rng.normal(size=1000), rng.normal(1.5, 1.0, 600)], bins=25,
       stacked=True, label=["a", "b"], alpha=0.85)
ax.set_title("Histogram"); ax.set_xlabel("value"); ax.set_ylabel("count")
ax.legend()
fig.tight_layout()
Total running time of the script: (0 minutes 0.068 seconds)