Axes & figure manipulation

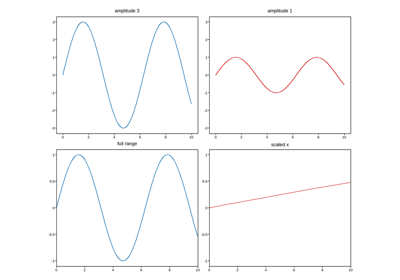
Post-creation manipulation of axes and figures – spines, per-axes cosmetics, tick placement, axes lifecycle, and the small matplotlib-compatibility conveniences (axis(), persistent margins(), per-axes prop cycles) that sit alongside the plotting methods themselves.
Spines

Spines

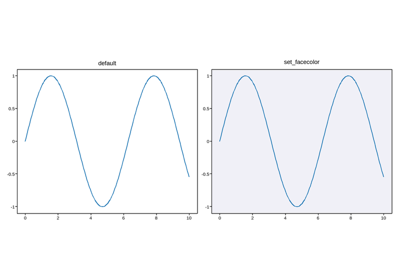
Per-axes facecolor

Per-axes facecolor

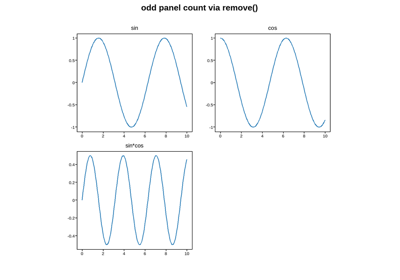
Hiding and removing axes

Hiding and removing axes

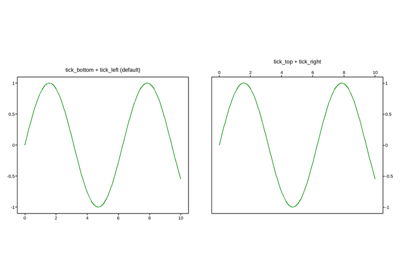
Tick position

Tick position

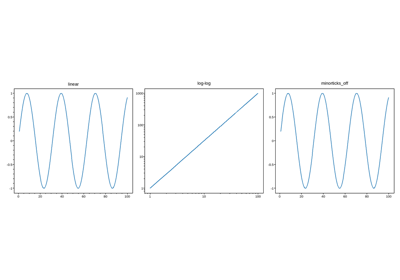
Minor ticks

Minor ticks

Linking axes after creation

Linking axes after creation

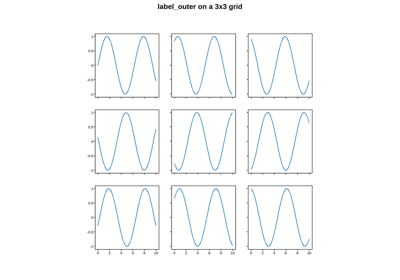
label_outer

label_outer

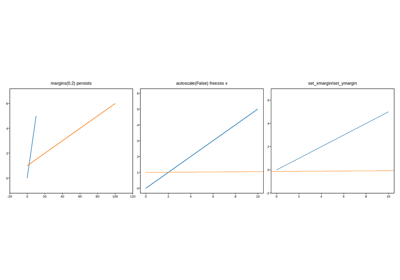
Margins and autoscale

Margins and autoscale

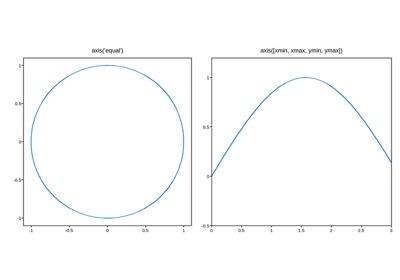
axis() convenience

axis() convenience

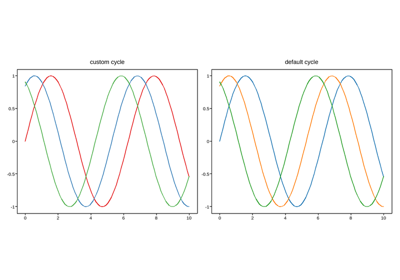
Per-axes color cycle

Per-axes color cycle

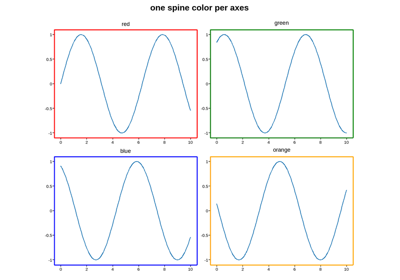
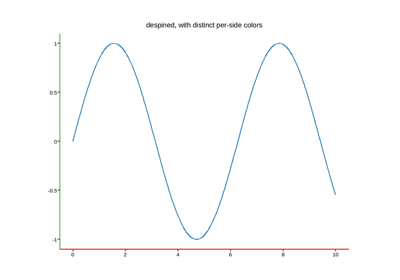
A different spine color per axes

A different spine color per axes

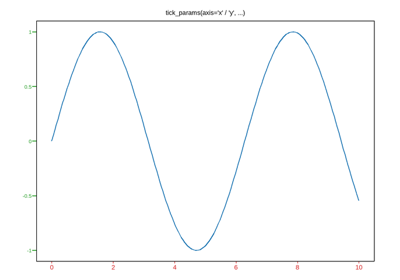
Tick styling

Tick styling

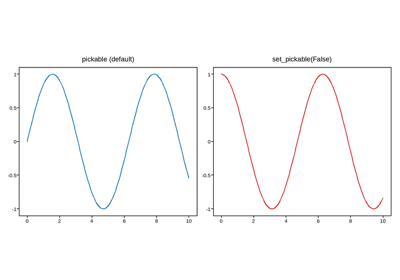
Restricting point picking to one axes

Restricting point picking to one axes

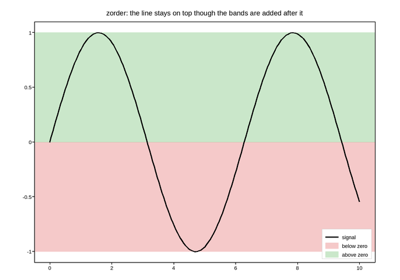
Draw order (zorder)

Draw order (zorder)

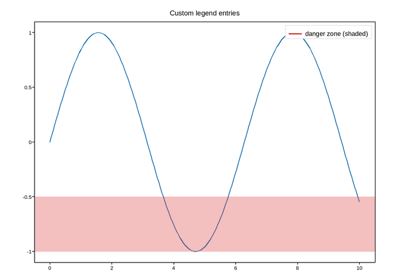
Custom legend entries

Custom legend entries

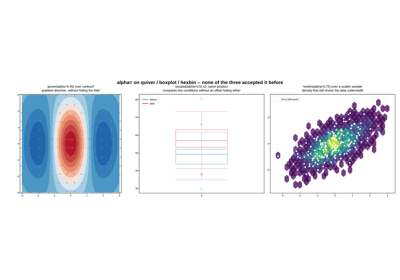
alpha, now everywhere matplotlib has it

alpha, now everywhere matplotlib has it

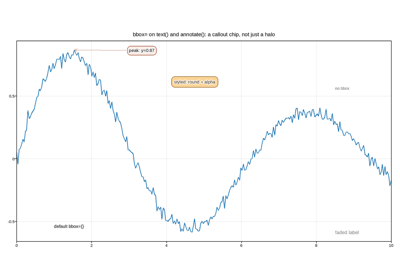
Boxed text and callouts (bbox=)

Boxed text and callouts (bbox=)

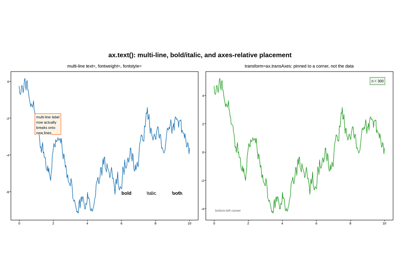
Multi-line, bold/italic, and axes-pinned text

Multi-line, bold/italic, and axes-pinned text

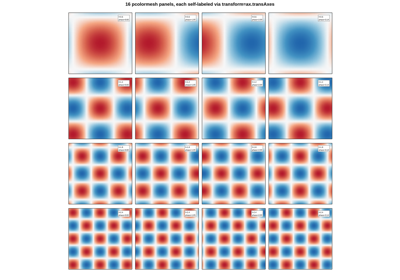
A 4x4 grid, each panel labeled in its own corner

A 4x4 grid, each panel labeled in its own corner

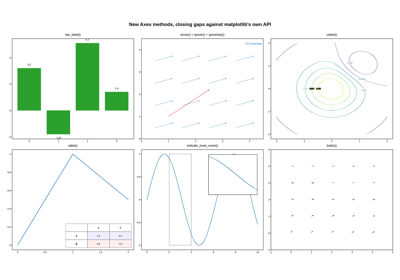
Six methods closing gaps against matplotlib’s Axes API

Six methods closing gaps against matplotlib's Axes API
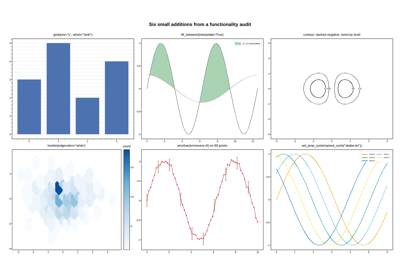
Six small additions from a functionality audit

Six small additions from a functionality audit

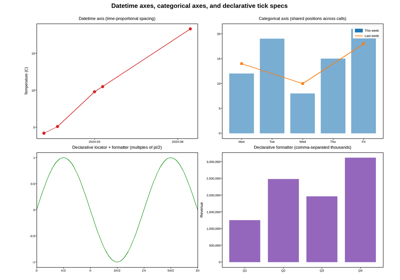
Datetime axes, categorical axes, and declarative tick specs

Datetime axes, categorical axes, and declarative tick specs
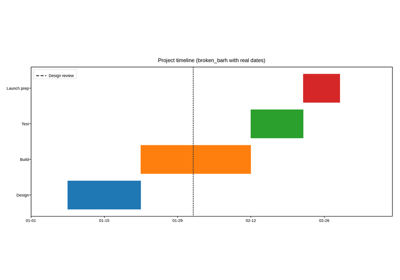
Datetime Gantt chart with milestones

Datetime Gantt chart with milestones

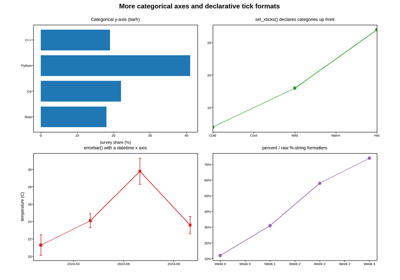
More categorical axes and declarative tick formats

More categorical axes and declarative tick formats
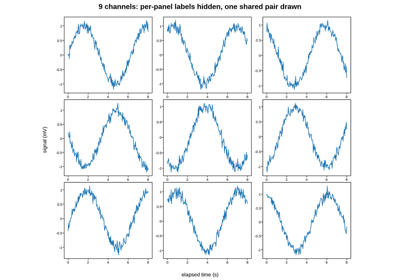
Hidden axis labels (stored, not drawn)

Hidden axis labels (stored, not drawn)

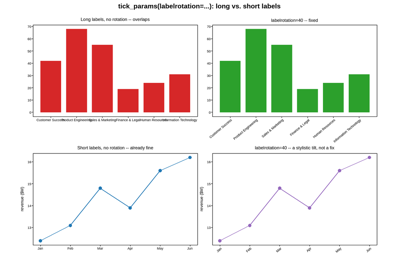
Diagonal tick labels

Diagonal tick labels

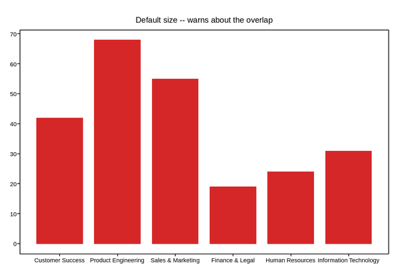
Warning about (and auto-fixing) crowded labels

Warning about (and auto-fixing) crowded labels