Note
Go to the end to download the full example code.
Custom legend entries
handles builds a legend that doesn’t map 1:1 to what’s plotted – here,
a proxy line stands in for a shaded band that has no color/marker of its
own to draw a swatch from. labels overrides the text shown, positionally;
fontsize overrides the entry text size.
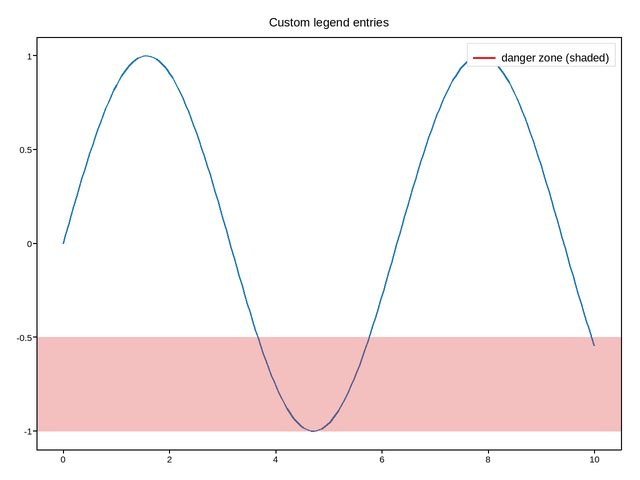
Live figure — pick a tool, then zoom, pan, point-pick or annotate. Nothing is active until a tool is selected.
View this figure’s Vega export ↗ — the raw JSON spec, rendered live by a real Vega engine.
View this figure’s Vega-Lite export ↗ — the raw JSON spec(s), rendered live by a real Vega-Lite engine.
import numpy as np
import plotpress
from plotpress.artists import Line2D

x = np.linspace(0, 10, 200)
fig, ax = plotpress.subplots()
ax.plot(x, np.sin(x), color="C0")
ax.axhspan(-1, -0.5, color="#d62728", alpha=0.3)

band_proxy = Line2D(np.array([0.0]), np.array([0.0]), color="#d62728", linewidth=8)
ax.legend(handles=[band_proxy], labels=["danger zone (shaded)"], fontsize=11)
ax.set_title("Custom legend entries")
fig.tight_layout()
Total running time of the script: (0 minutes 0.070 seconds)