Note
Go to the end to download the full example code.
Margins and autoscale
margins sets a persistent padding fraction that keeps re-applying as
more data is added; autoscale(enable=False) freezes the current limits so
later data no longer moves them. set_xmargin/set_ymargin are the
per-axis equivalent of margins(x=...)/margins(y=...) – handy when
only one axis needs a different padding fraction than the other.
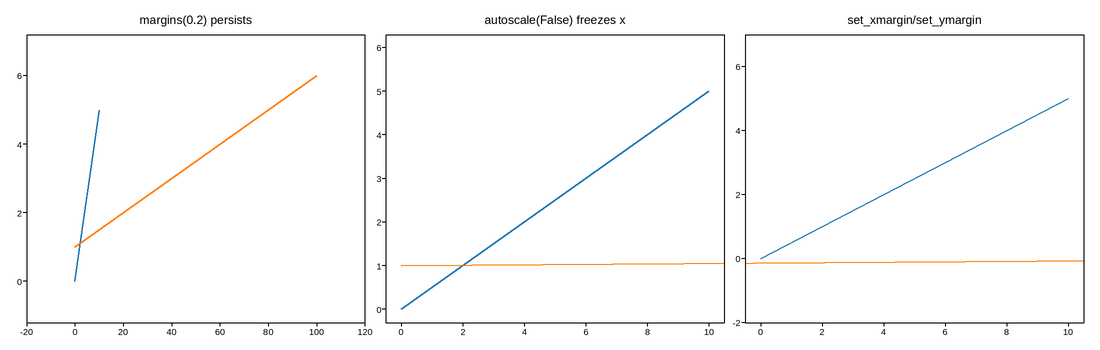
Live figure — pick a tool, then zoom, pan, point-pick or annotate. Nothing is active until a tool is selected.
View this figure’s Vega export ↗ — the raw JSON spec, rendered live by a real Vega engine.
View this figure’s Vega-Lite export ↗ — the raw JSON spec(s), rendered live by a real Vega-Lite engine.
import numpy as np
import plotpress

fig, (ax1, ax2, ax3) = plotpress.subplots(1, 3, figsize=(11, 3.5))

ax1.plot([0, 10], [0, 5])
ax1.margins(0.2)
ax1.plot([0, 100], [1, 6])         # added after margins() -- still padded 20%
ax1.set_title("margins(0.2) persists")

ax2.plot([0, 10], [0, 5])
ax2.autoscale(enable=False, axis="x")
ax2.plot([0, 1000], [1, 6])        # x is frozen; new data no longer widens it
ax2.set_title("autoscale(False) freezes x")

ax3.plot([0, 10], [0, 5])
ax3.set_xmargin(0.05)               # tight on x
ax3.set_ymargin(0.4)                 # loose on y
ax3.set_title("set_xmargin/set_ymargin")
fig.tight_layout()
Total running time of the script: (0 minutes 0.093 seconds)