Note
Go to the end to download the full example code.
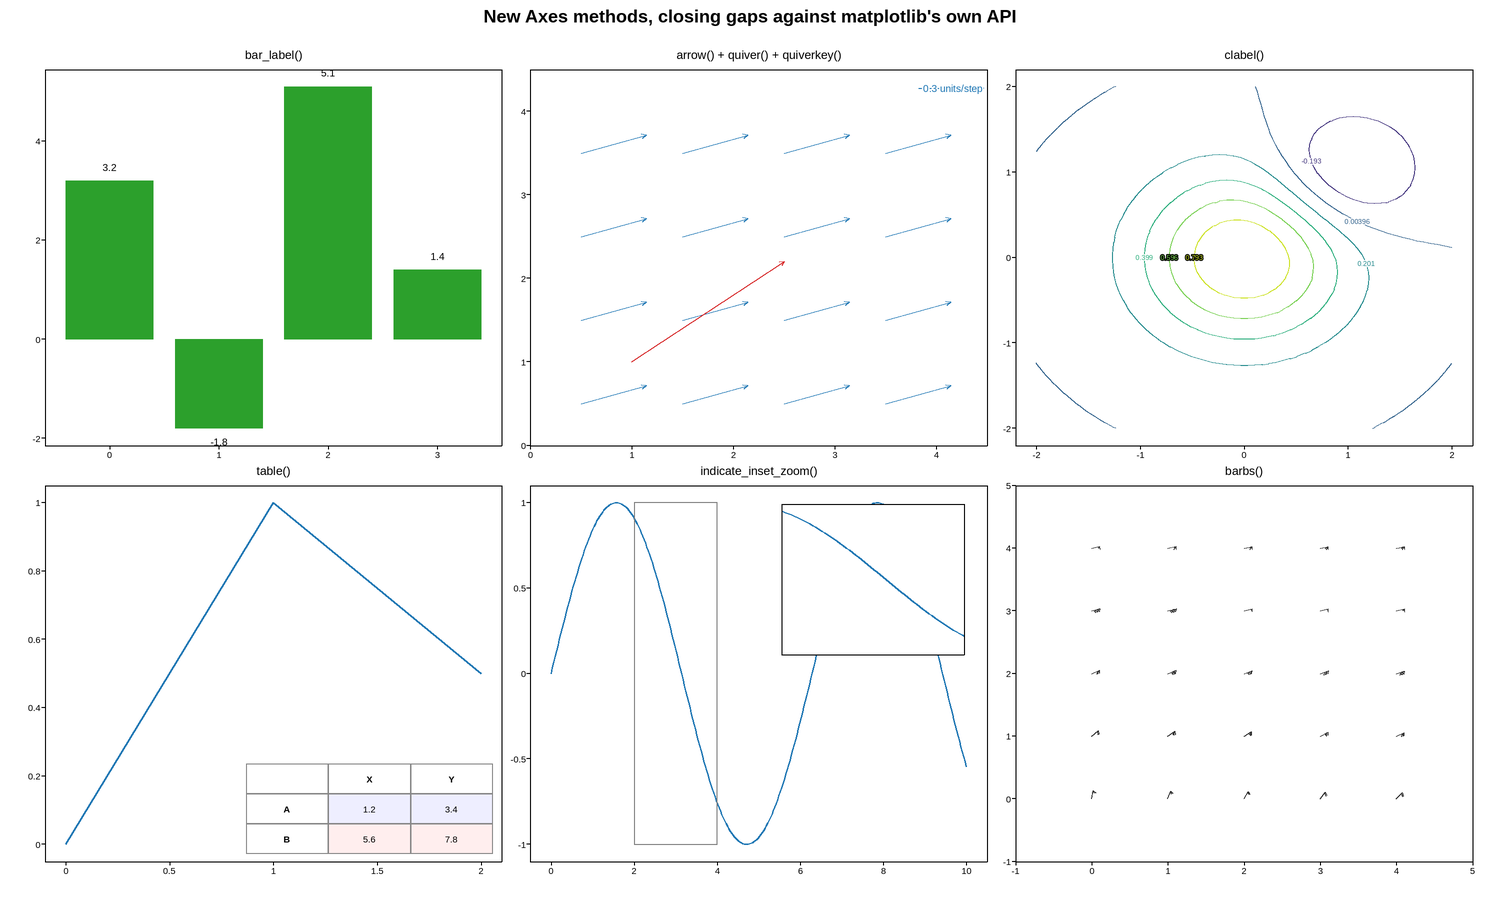
Six methods closing gaps against matplotlib’s Axes API
An audit against matplotlib’s own Axes turned up several plotting
methods plotpress didn’t have yet. Six of them, together: bar_label()
auto-labeling bar values, arrow()/quiverkey() alongside an existing
quiver() field, clabel() labeling contour lines with their values,
table() for a grid of cells, indicate_inset_zoom() marking the
region an inset zooms into, and barbs() for wind-barb symbols.
This figure has 7 panels — too many to usefully embed at a fixed size.
Open the full interactive example in a new page to pick a tool, then zoom, pan, point-pick or annotate any panel.
View this figure’s Vega export ↗ — the raw JSON spec, rendered live by a real Vega engine.
View this figure’s Vega-Lite export ↗ — the raw JSON spec(s), rendered live by a real Vega-Lite engine.
import numpy as np
import plotpress

fig, axes = plotpress.subplots(2, 3, figsize=(15.0, 9.0))

# -- bar_label(): auto-label each bar with its own value ---------------
ax = axes[0, 0]
bars = ax.bar([0, 1, 2, 3], [3.2, -1.8, 5.1, 1.4], color="#2ca02c")
ax.bar_label(bars, padding=2)
ax.set_title("bar_label()")

# -- arrow() + quiver() + quiverkey() -----------------------------------
ax = axes[0, 1]
X, Y = np.meshgrid(np.linspace(0.5, 3.5, 4), np.linspace(0.5, 3.5, 4))
Q = ax.quiver(X, Y, np.ones_like(X) * 0.3, np.ones_like(Y) * 0.1, color="#1f77b4")
ax.arrow(1.0, 1.0, 1.5, 1.2, color="#d62728")   # a single, separately-placed arrow
ax.set_xlim(0, 4.5)
ax.set_ylim(0, 4.5)
# quiverkey() needs the axes' final limits already set -- it resolves its
# own axes-fraction (X, Y) to a data point at call time, not at render time
# the way text()'s transform=ax.transAxes does.
ax.quiverkey(Q, 0.85, 0.95, 0.3, "0.3 units/step", coordinates="axes")
ax.set_title("arrow() + quiver() + quiverkey()")

# -- clabel(): label contour lines with their level values --------------
ax = axes[0, 2]
g = np.linspace(-2, 2, 60)
Xc, Yc = np.meshgrid(g, g)
Z = np.exp(-(Xc ** 2 + Yc ** 2)) - 0.5 * np.exp(-((Xc - 1) ** 2 + (Yc - 1) ** 2) * 2)
CS = ax.contour(g, g, Z, levels=6)
ax.clabel(CS, fontsize=7)
ax.set_title("clabel()")

# -- table(): a grid of cells, axes-fraction positioned ------------------
ax = axes[1, 0]
ax.plot([0, 1, 2], [0, 1, 0.5], color="#1f77b4")
ax.table(cellText=[["1.2", "3.4"], ["5.6", "7.8"]], rowLabels=["A", "B"],
         colLabels=["X", "Y"], loc="lower right",
         cellColours=[["#eef", "#eef"], ["#fee", "#fee"]])
ax.set_title("table()")

# -- indicate_inset_zoom(): mark what region an inset shows --------------
ax = axes[1, 1]
xd = np.linspace(0, 10, 300)
ax.plot(xd, np.sin(xd), color="#1f77b4")
inset = ax.inset_axes([0.55, 0.55, 0.4, 0.4])
inset.plot(xd, np.sin(xd), color="#1f77b4")
inset.set_xlim(2, 4)
inset.set_ylim(-1, 1)
inset.set_xticks([])
inset.set_yticks([])
ax.indicate_inset_zoom(inset)
ax.set_title("indicate_inset_zoom()")

# -- barbs(): wind barbs, speed 2 to 65 ------------------------------------
ax = axes[1, 2]
Xb, Yb = np.meshgrid(np.arange(5), np.arange(5))
Ub = np.linspace(2, 65, 25).reshape(5, 5)
Vb = np.full((5, 5), 15.0)
ax.barbs(Xb, Yb, Ub, Vb, length=6, color="#333333")
ax.set_xlim(-1, 5)
ax.set_ylim(-1, 5)
ax.set_title("barbs()")

fig.suptitle("New Axes methods, closing gaps against matplotlib's own API")
fig.tight_layout()
Total running time of the script: (0 minutes 0.563 seconds)