Note
Go to the end to download the full example code.
Datetime Gantt chart with milestones
broken_barh’s (start, width) spans accept a datetime-like start –
handy for a real-dates Gantt chart, where plot_11_broken_barh (in the
pairwise gallery) uses plain day-offsets instead. Widths stay plain numbers
either way: a span’s duration, not a position, in days on a date axis.
axvline and set_xlim both accept dates too, for marking a milestone
and framing the visible window.
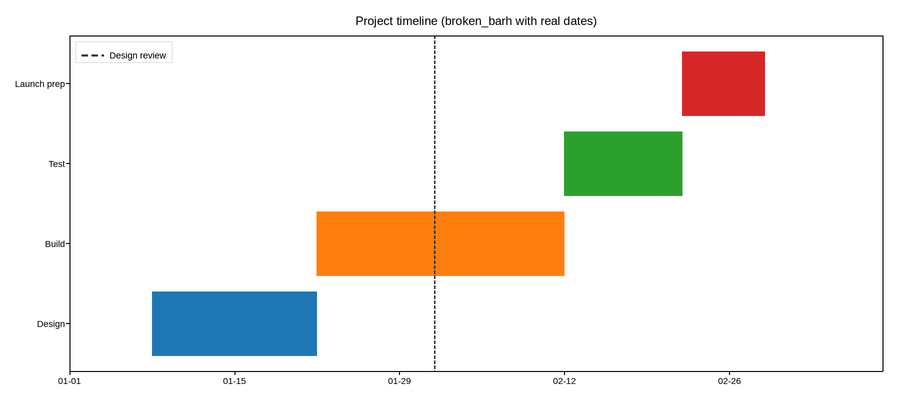
Live figure — pick a tool, then zoom, pan, point-pick or annotate. Nothing is active until a tool is selected.
View this figure’s Vega export ↗ — the raw JSON spec, rendered live by a real Vega engine.
View this figure’s Vega-Lite export ↗ — the raw JSON spec(s), rendered live by a real Vega-Lite engine.
import datetime as dt

import plotpress

fig, ax = plotpress.subplots(figsize=(9.0, 4.0))

tasks = [
    ("Design", dt.date(2024, 1, 8), 14, "#1f77b4"),
    ("Build", dt.date(2024, 1, 22), 21, "#ff7f0e"),
    ("Test", dt.date(2024, 2, 12), 10, "#2ca02c"),
    ("Launch prep", dt.date(2024, 2, 22), 7, "#d62728"),
]
for i, (name, start, days, color) in enumerate(tasks):
    ax.broken_barh([(start, days)], (i * 10, 8), color=color)

ax.set_yticks([i * 10 + 4 for i in range(len(tasks))])
ax.set_yticklabels([name for name, *_ in tasks])
ax.set_ylim(-2, len(tasks) * 10)

# A real datetime milestone marker -- axvline resolves it the same way
# plot()'s own x/y do.
ax.axvline(dt.date(2024, 2, 1), color="#333333", linestyle="--", label="Design review")
ax.legend(loc="upper left")

# set_xlim accepts ISO date strings once the axis has seen date data.
ax.set_xlim("2024-01-01", "2024-03-10")
ax.set_title("Project timeline (broken_barh with real dates)")
fig.tight_layout()
Total running time of the script: (0 minutes 0.095 seconds)