Note
Go to the end to download the full example code.
Warning about (and auto-fixing) crowded labels
tight_layout() only ever reserves one text row per tick/label, so it
has no way to notice an unrotated x tick label running into its neighbor,
or a title wider than the axes it sits over – fixing that means picking a
smaller font, rotating the labels, shortening the text, or widening the
figure, a choice only the caller can make. By default it warns and names a
concrete fix; tight_layout(auto_label_scale=True) picks the “smaller
font” fix itself, for whichever text has a per-instance size to shrink
(tick labels, an axes title, a group title – not a plain set_xlabel,
which has none), down to a legibility floor.
import plotpress

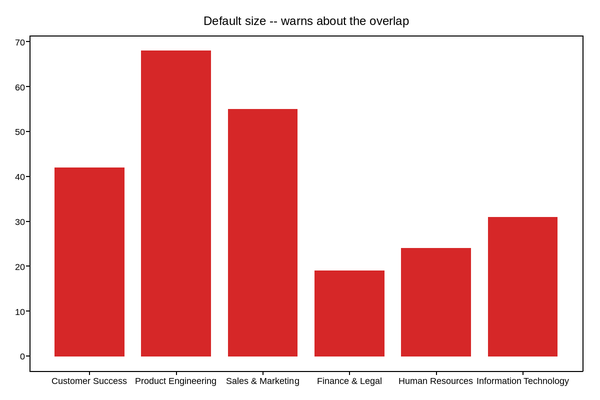
departments = ["Customer Success", "Product Engineering", "Sales & Marketing",
               "Finance & Legal", "Human Resources", "Information Technology"]
headcount = [42, 68, 55, 19, 24, 31]

fig, ax = plotpress.subplots(figsize=(6.0, 4.0))
ax.bar(departments, headcount, color="#d62728")
ax.set_title("Default size -- warns about the overlap")
fig.tight_layout()
Live figure — pick a tool, then zoom, pan, point-pick or annotate. Nothing is active until a tool is selected.
View this figure’s Vega export ↗ — the raw JSON spec, rendered live by a real Vega engine.
View this figure’s Vega-Lite export ↗ — the raw JSON spec(s), rendered live by a real Vega-Lite engine.
/home/runner/work/plotpress/plotpress/docs/examples/axes_features/plot_27_auto_label_scale.py:24: UserWarning: tight_layout(): the 'Default size -- warns about the overlap'-titled axes's x tick labels are wider (~94px) than their average spacing (~92px) and may overlap -- try tick_params(axis='x', labelrotation=45) to angle them, tick_params(axis='x', labelsize=<smaller>) to shrink them, tight_layout(auto_label_scale=True) to shrink them automatically, or set_xticks(...) to thin them out.
  fig.tight_layout()
fig.tight_layout() above prints a UserWarning naming the overlap and
how to fix it, but leaves the labels exactly as given – deciding the fix is
the caller’s call, not tight_layout()’s to make silently. Asking for
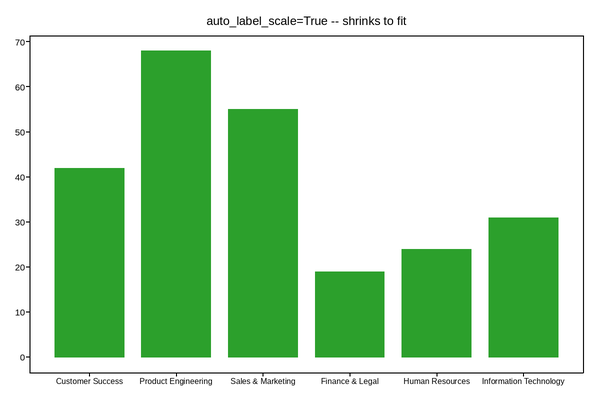
auto_label_scale=True instead makes that call automatically:
fig2, ax2 = plotpress.subplots(figsize=(6.0, 4.0))
ax2.bar(departments, headcount, color="#2ca02c")
ax2.set_title("auto_label_scale=True -- shrinks to fit")
fig2.tight_layout(auto_label_scale=True)
Live figure — pick a tool, then zoom, pan, point-pick or annotate. Nothing is active until a tool is selected.
View this figure’s Vega export ↗ — the raw JSON spec, rendered live by a real Vega engine.
View this figure’s Vega-Lite export ↗ — the raw JSON spec(s), rendered live by a real Vega-Lite engine.
The same fix is also available as one call: tick_params(axis="x",
labelrotation=...) (see the previous example) usually reads better for a
grid of long category names – auto_label_scale is the option for
whenever a smaller font is the better fix instead, or the fastest fix “make
it warn until I have time to pick a look.”
Total running time of the script: (0 minutes 0.119 seconds)