Note
Go to the end to download the full example code.
Six small additions from a functionality audit
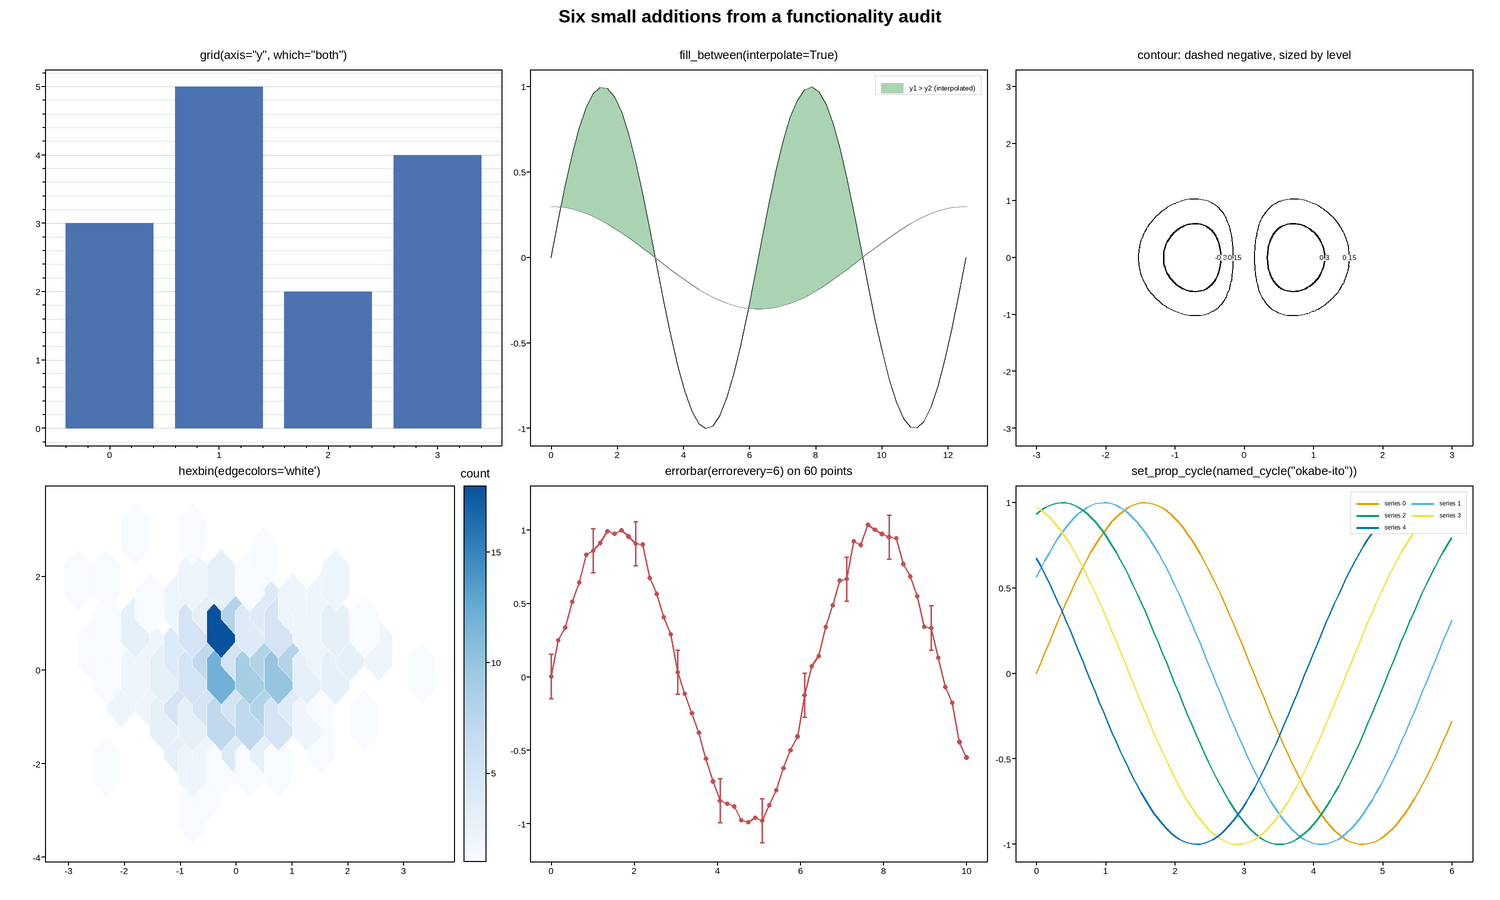
grid(axis=, which=) restricts gridlines to one direction and/or adds a
minor grid; fill_between(interpolate=True) extends a shaded region to
the exact crossing point instead of stopping at the last sample inside it;
contour’s linewidths/linestyles (with negative levels dashed by
default, for an explicit single color) read a signed field’s zero crossing
without a colorbar; hexbin(edgecolors=) separates a sparse bin count;
errorbar(errorevery=) thins a dense series’ whiskers without touching
its line or markers; and plotpress.style.named_cycle("okabe-ito") swaps
in a colorblind-safe palette with no other code change.
Live figure — pick a tool, then zoom, pan, point-pick or annotate. Nothing is active until a tool is selected.
View this figure’s Vega export ↗ — the raw JSON spec, rendered live by a real Vega engine.
View this figure’s Vega-Lite export ↗ — the raw JSON spec(s), rendered live by a real Vega-Lite engine.
import numpy as np
import plotpress
from plotpress.style import named_cycle

fig, axes = plotpress.subplots(2, 3, figsize=(15.0, 9.0))

# -- grid(axis=, which=): gridlines along one direction, plus minor -------
ax = axes[0, 0]
ax.bar([0, 1, 2, 3], [3, 5, 2, 4], color="#4c72b0")
ax.grid(True, axis="y", which="both")
ax.minorticks_on()
ax.set_title('grid(axis="y", which="both")')

# -- fill_between(interpolate=True): extend to the true crossing ---------
ax = axes[0, 1]
x = np.linspace(0, 4 * np.pi, 60)
y1, y2 = np.sin(x), 0.3 * np.cos(x / 2)
ax.plot(x, y1, color="#333333", linewidth=1)
ax.plot(x, y2, color="#888888", linewidth=1)
ax.fill_between(x, y1, y2, where=y1 > y2, interpolate=True,
                color="#55a868", alpha=0.5, label="y1 > y2 (interpolated)")
ax.legend(fontsize=7)
ax.set_title("fill_between(interpolate=True)")

# -- contour: linewidths/linestyles, negative levels dashed by default ---
ax = axes[0, 2]
g = np.linspace(-3, 3, 150)
X, Y = np.meshgrid(g, g)
Z = X * np.exp(-(X ** 2 + Y ** 2))   # a signed field, positive and negative lobes
cs = ax.contour(g, g, Z, levels=[-0.3, -0.15, 0.15, 0.3],
               colors="black", linewidths=[1.5, 1, 1, 1.5])
ax.clabel(cs, fontsize=7)
ax.set_title("contour: dashed negative, sized by level")

# -- hexbin(edgecolors=): separate a sparse bin count ----------------------
ax = axes[1, 0]
rng = np.random.default_rng(3)
hb = ax.hexbin(rng.normal(size=250), rng.normal(size=250), gridsize=12,
              cmap="Blues", edgecolors="white", linewidths=0.6)
fig.colorbar(hb, ax, label="count")
ax.set_title("hexbin(edgecolors='white')")

# -- errorbar(errorevery=): thin whiskers, not the line or markers --------
ax = axes[1, 1]
xe = np.linspace(0, 10, 60)
ye = np.sin(xe) + rng.normal(scale=0.05, size=xe.size)
ax.errorbar(xe, ye, yerr=0.15, errorevery=6, color="#c44e52",
           markersize=3, capsize=2)
ax.set_title("errorbar(errorevery=6) on 60 points")

# -- named_cycle("okabe-ito"): a colorblind-safe palette, no other change -
ax = axes[1, 2]
ax.set_prop_cycle(named_cycle("okabe-ito"))
xp = np.linspace(0, 6, 100)
for i in range(5):
    ax.plot(xp, np.sin(xp + i * 0.6), label=f"series {i}")
ax.legend(fontsize=6, ncol=2)
ax.set_title('set_prop_cycle(named_cycle("okabe-ito"))')

fig.suptitle("Six small additions from a functionality audit")
fig.tight_layout()
Total running time of the script: (0 minutes 1.243 seconds)