Note
Go to the end to download the full example code.
Hiding and removing axes
set_visible(False) blanks an axes but keeps its grid cell reserved;
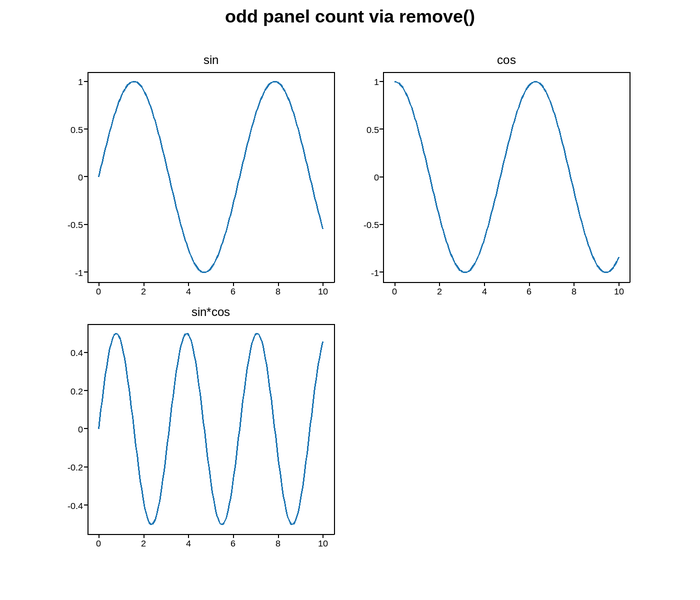
remove() detaches it from the figure entirely – handy for an odd number
of panels on a rectangular grid, like the empty fourth cell here.
Live figure — pick a tool, then zoom, pan, point-pick or annotate. Nothing is active until a tool is selected.
View this figure’s Vega export ↗ — the raw JSON spec, rendered live by a real Vega engine.
View this figure’s Vega-Lite export ↗ — the raw JSON spec(s), rendered live by a real Vega-Lite engine.
import numpy as np
import plotpress

x = np.linspace(0, 10, 200)

fig, axes = plotpress.subplots(2, 2, figsize=(7, 6))
axes[0, 0].plot(x, np.sin(x)); axes[0, 0].set_title("sin")
axes[0, 1].plot(x, np.cos(x)); axes[0, 1].set_title("cos")
axes[1, 0].plot(x, np.sin(x) * np.cos(x)); axes[1, 0].set_title("sin*cos")
axes[1, 1].remove()   # only three series to show -- drop the unused panel
fig.suptitle("odd panel count via remove()")
Total running time of the script: (0 minutes 0.110 seconds)