Note
Go to the end to download the full example code.
Multi-line, bold/italic, and axes-pinned text
Three more ax.text()/ax.annotate() features beyond alpha= and
bbox= (see the previous example): a \n in the string now actually
breaks into multiple lines (each independently aligned per ha, the block
as a whole placed per va) rather than running together on one;
fontweight="bold"/fontstyle="italic" select the glyph face; and
transform=ax.transAxes places (x, y) as an axes-fraction position –
(0, 0) bottom-left, (1, 1) top-right – instead of data coordinates,
so a label stays pinned to a corner of the axes regardless of the data
underneath it.
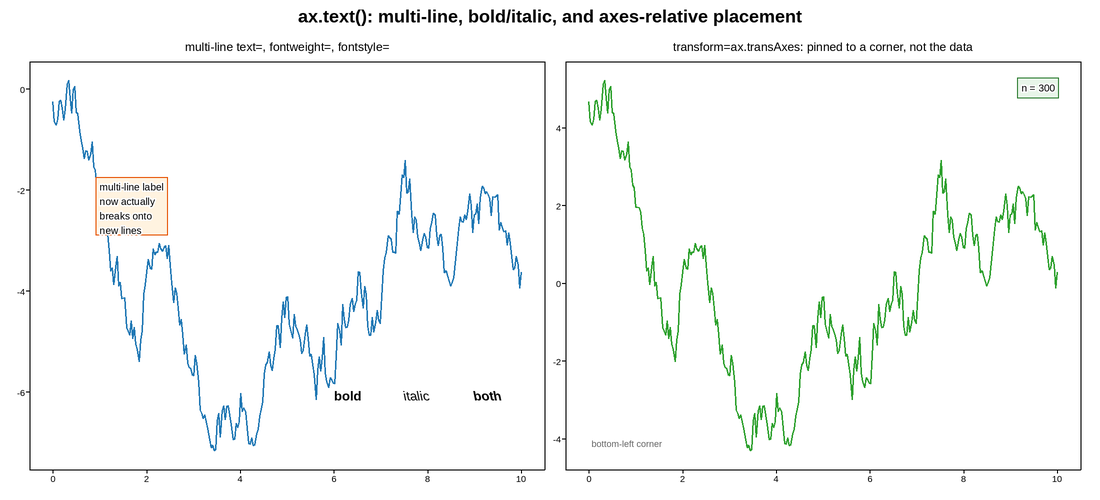
Live figure — pick a tool, then zoom, pan, point-pick or annotate. Nothing is active until a tool is selected.
View this figure’s Vega export ↗ — the raw JSON spec, rendered live by a real Vega engine.
View this figure’s Vega-Lite export ↗ — the raw JSON spec(s), rendered live by a real Vega-Lite engine.
import numpy as np
import plotpress

rng = np.random.default_rng(5)
x = np.linspace(0, 10, 300)
y = np.cumsum(rng.normal(scale=0.3, size=x.size))

fig, (ax_left, ax_right) = plotpress.subplots(1, 2, figsize=(11.0, 5.0))

# -- multi-line + fontweight/fontstyle --------------------------------------
ax_left.plot(x, y, color="#1f77b4", linewidth=1.4)
ax_left.text(1.0, y.max() - 2, "multi-line label\nnow actually\nbreaks onto\nnew lines",
            va="top", bbox={"facecolor": "#fff3e0", "edgecolor": "#e65100"})
ax_left.text(6.0, y.min() + 1, "bold", fontweight="bold", fontsize=13)
ax_left.text(7.5, y.min() + 1, "italic", fontstyle="italic", fontsize=13)
ax_left.text(9.0, y.min() + 1, "both", fontweight="bold", fontstyle="italic", fontsize=13)
ax_left.set_title("multi-line text=, fontweight=, fontstyle=")

# -- transform=ax.transAxes: pinned to a corner, independent of the data ---
ax_right.plot(x, y * 1.3 + 5, color="#2ca02c", linewidth=1.4)
# A watermark-style label in the top-right corner -- (0.95, 0.95) is always
# "near the top-right corner", however the data above happens to be scaled,
# panned, or zoomed; the same call with data coordinates would need
# recomputing every time the y-range changed.
ax_right.text(0.95, 0.95, "n = %d" % x.size, transform=ax_right.transAxes,
             ha="right", va="top",
             bbox={"facecolor": "#e8f5e9", "edgecolor": "#2e7d32"})
ax_right.text(0.05, 0.05, "bottom-left corner", transform=ax_right.transAxes,
             ha="left", va="bottom", color="#666666", fontsize=9)
ax_right.set_title("transform=ax.transAxes: pinned to a corner, not the data")

fig.suptitle("ax.text(): multi-line, bold/italic, and axes-relative placement")
fig.tight_layout()
Total running time of the script: (0 minutes 0.174 seconds)