Note
Go to the end to download the full example code.
alpha, now everywhere matplotlib has it
alpha= used to stop at whichever methods happened to add it early –
contourf had it, its own sibling contour didn’t; imshow had it,
matshow/spy/hist2d (all built on it) didn’t expose a way to pass
one through; quiver/eventplot/pie/boxplot/violinplot/
hexbin never had it at all. Every one of those now takes alpha=,
matching matplotlib.
The three panels below aren’t a coverage checklist – they’re three real reasons a previously missing alpha mattered: a vector field drawn over a scalar field it would otherwise blot out, two conditions’ boxplots compared at the same position, and a density estimate that needs to admit what data built it.
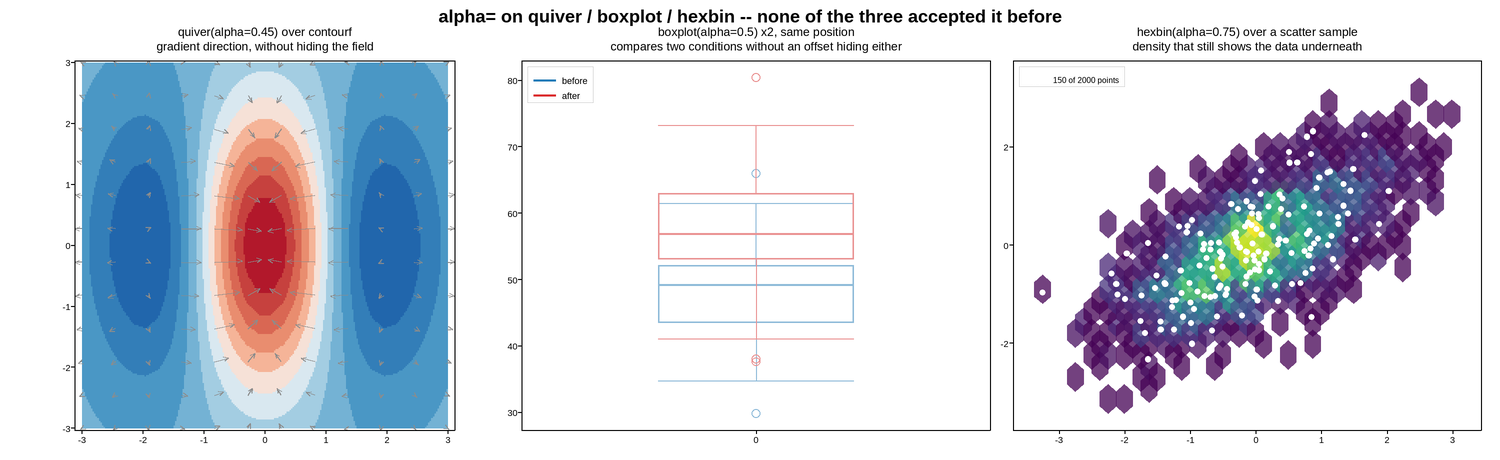
Live figure — pick a tool, then zoom, pan, point-pick or annotate. Nothing is active until a tool is selected.
View this figure’s Vega export ↗ — the raw JSON spec, rendered live by a real Vega engine.
View this figure’s Vega-Lite export ↗ — the raw JSON spec(s), rendered live by a real Vega-Lite engine.
/home/runner/work/plotpress/plotpress/docs/examples/axes_features/plot_16_alpha_everywhere.py:63: UserWarning: tight_layout(): the 'boxplot(alpha=0.5) x2, same position\ncompares two conditions without an offset hiding either'-titled axes's title (~495px) is wider than its own axes (~468px) and may run past its edges -- try set_title(..., size=<smaller>), shorter text, tight_layout(auto_label_scale=True) to shrink it automatically, or a wider figure.
  fig.tight_layout()
import numpy as np
import plotpress

rng = np.random.default_rng(7)

fig, (ax_field, ax_box, ax_hex) = plotpress.subplots(1, 3, figsize=(15.0, 4.6))

# -- 1. quiver over contourf: the arrows need to not blot out the field ----
g = np.linspace(-3.0, 3.0, 30)
X, Y = np.meshgrid(g, g)
Z = np.exp(-(X ** 2 + Y ** 2) / 5.0) * np.cos(1.3 * X)
ax_field.contourf(g, g, Z, levels=12, cmap="RdBu_r")
# The gradient direction, sparsely sampled -- solid black arrows over a
# filled field read as clutter; quiver had no alpha to fix that until now.
gs = np.linspace(-3.0, 3.0, 12)
Xs, Ys = np.meshgrid(gs, gs)
Zs = np.exp(-(Xs ** 2 + Ys ** 2) / 5.0) * np.cos(1.3 * Xs)
dZdx = -Xs / 2.5 * Zs - 1.3 * np.exp(-(Xs ** 2 + Ys ** 2) / 5.0) * np.sin(1.3 * Xs)
dZdy = -Ys / 2.5 * Zs
ax_field.quiver(Xs, Ys, dZdx, dZdy, color="black", alpha=0.45)
ax_field.set_title("quiver(alpha=0.45) over contourf\ngradient direction, without hiding the field")
ax_field.set_aspect("equal")

# -- 2. two boxplots at the same position: alpha instead of an offset ------
before = rng.normal(50, 8, 60)
after = rng.normal(58, 10, 60)
ax_box.boxplot([before], positions=[0], color="#1f77b4", alpha=0.5,
              label="before")
ax_box.boxplot([after], positions=[0], color="#d62728", alpha=0.5,
              label="after")
ax_box.set_xlim(-0.6, 0.6)
ax_box.set_xticks([0])
ax_box.set_title("boxplot(alpha=0.5) x2, same position\ncompares two conditions without an offset hiding either")
ax_box.legend(loc="upper left")

# -- 3. hexbin admitting the raw points that built it -----------------------
px = rng.normal(size=2000)
py = 0.6 * px + rng.normal(scale=0.7, size=2000)
ax_hex.hexbin(px, py, gridsize=25, cmap="viridis", alpha=0.75)
ax_hex.scatter(px[:150], py[:150], s=4.0, color="white", alpha=0.6,
              label="150 of 2000 points")
ax_hex.set_title("hexbin(alpha=0.75) over a scatter sample\ndensity that still shows the data underneath")
ax_hex.legend(loc="upper left", fontsize=8)

fig.suptitle("alpha= on quiver / boxplot / hexbin -- none of the three accepted it before")
fig.tight_layout()
Total running time of the script: (0 minutes 0.318 seconds)