Note
Go to the end to download the full example code.
Diagonal tick labels
tick_params(labelrotation=...) angles the tick labels instead of leaving
them horizontal – the standard fix once category names are long enough to
run into their neighbors. The top row plots the same long department names
with and without it; the bottom row does the same for short month
abbreviations, to show a modest rotation is a reasonable default even when
the labels were never going to collide – it just reads as a stylistic
tilt rather than a fix for anything.
A nonzero labelrotation also right-anchors the label against its own
tick (unlike matplotlib, which needs a separate ha="right" for this) –
tilted text centered on its tick just leans oddly rather than reading
naturally, so there’s no reason to make that a second setting.
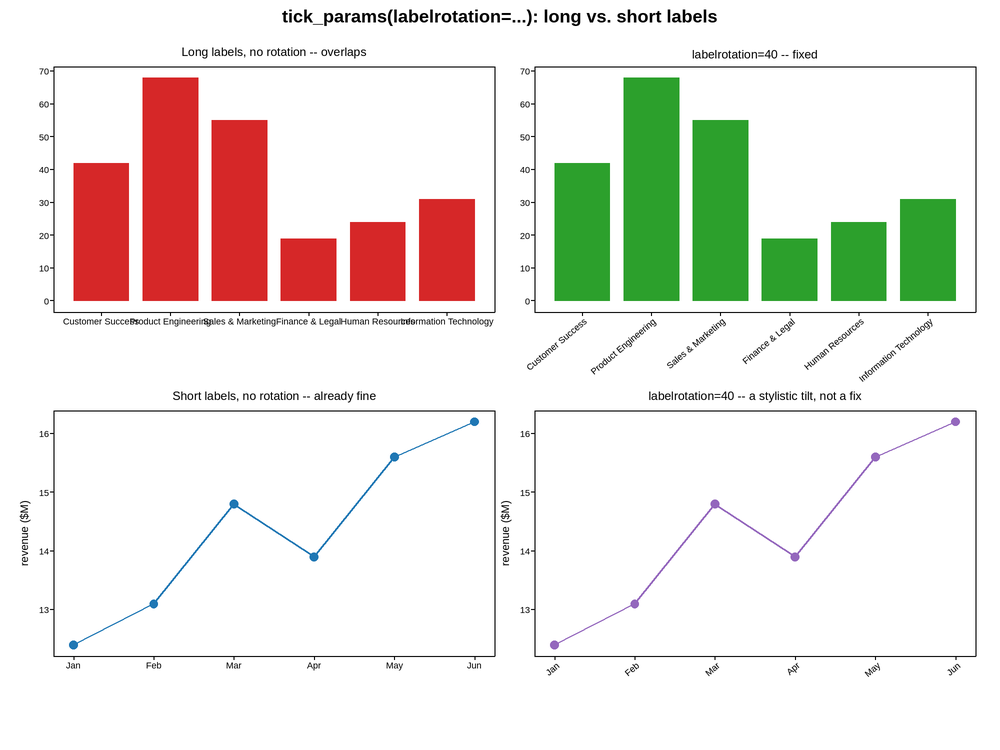
Live figure — pick a tool, then zoom, pan, point-pick or annotate. Nothing is active until a tool is selected.
View this figure’s Vega export ↗ — the raw JSON spec, rendered live by a real Vega engine.
View this figure’s Vega-Lite export ↗ — the raw JSON spec(s), rendered live by a real Vega-Lite engine.
/home/runner/work/plotpress/plotpress/docs/examples/axes_features/plot_26_diagonal_tick_labels.py:49: UserWarning: tight_layout(): the 'Long labels, no rotation -- overlaps'-titled axes's x tick labels are wider (~94px) than their average spacing (~74px) and may overlap -- try tick_params(axis='x', labelrotation=45) to angle them, tick_params(axis='x', labelsize=<smaller>) to shrink them, tight_layout(auto_label_scale=True) to shrink them automatically, or set_xticks(...) to thin them out.
  fig.tight_layout()
import plotpress

departments = ["Customer Success", "Product Engineering", "Sales & Marketing",
               "Finance & Legal", "Human Resources", "Information Technology"]
headcount = [42, 68, 55, 19, 24, 31]
months = ["Jan", "Feb", "Mar", "Apr", "May", "Jun"]
revenue = [12.4, 13.1, 14.8, 13.9, 15.6, 16.2]

fig, axes = plotpress.subplots(2, 2, figsize=(10.0, 7.5))

ax = axes[0, 0]
ax.bar(departments, headcount, color="#d62728")
ax.set_title("Long labels, no rotation -- overlaps")

ax = axes[0, 1]
ax.bar(departments, headcount, color="#2ca02c")
ax.tick_params(axis="x", labelrotation=40)
ax.set_title("labelrotation=40 -- fixed")

ax = axes[1, 0]
ax.plot(months, revenue, marker="o", color="#1f77b4")
ax.set_ylabel("revenue ($M)")
ax.set_title("Short labels, no rotation -- already fine")

ax = axes[1, 1]
ax.plot(months, revenue, marker="o", color="#9467bd")
ax.tick_params(axis="x", labelrotation=40)
ax.set_ylabel("revenue ($M)")
ax.set_title("labelrotation=40 -- a stylistic tilt, not a fix")

fig.suptitle("tick_params(labelrotation=...): long vs. short labels")
fig.tight_layout()
Total running time of the script: (0 minutes 0.249 seconds)