Note
Go to the end to download the full example code.
Minor ticks
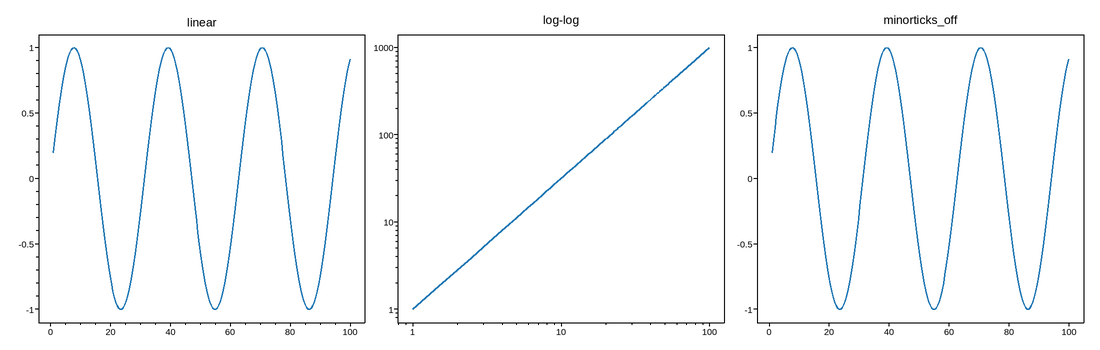
minorticks_on adds unlabeled subdivisions between the major ticks –
linear subdivisions on the left, sub-decade marks on a log axis in the
middle. minorticks_off (right) removes them again – the default, shown
here after first turning them on to make the round trip explicit.
Live figure — pick a tool, then zoom, pan, point-pick or annotate. Nothing is active until a tool is selected.
View this figure’s Vega export ↗ — the raw JSON spec, rendered live by a real Vega engine.
View this figure’s Vega-Lite export ↗ — the raw JSON spec(s), rendered live by a real Vega-Lite engine.
import numpy as np
import plotpress

x = np.linspace(1, 100, 200)

fig, axes = plotpress.subplots(1, 3, figsize=(11, 3.5))
axes[0].plot(x, np.sin(x / 5))
axes[0].minorticks_on()
axes[0].set_title("linear")

axes[1].loglog(x, x ** 1.5)
axes[1].minorticks_on()
axes[1].set_title("log-log")

axes[2].plot(x, np.sin(x / 5))
axes[2].minorticks_on()
axes[2].minorticks_off()
axes[2].set_title("minorticks_off")
fig.tight_layout()
Total running time of the script: (0 minutes 0.096 seconds)