Note
Go to the end to download the full example code.
Violin plot
Kernel-density silhouettes.
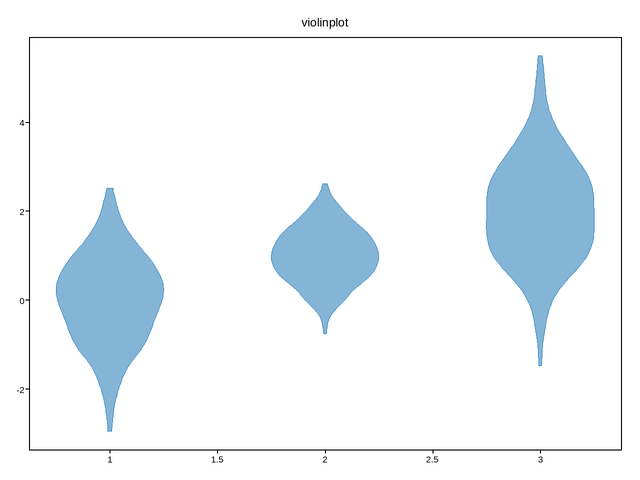
Live figure — pick a tool, then zoom, pan, point-pick or annotate. Nothing is active until a tool is selected.
import numpy as np
import plotpress

rng = np.random.default_rng(9)
data = [rng.normal(loc, s, 300) for loc, s in [(0, 1), (1, 0.6), (2, 1.3)]]
fig, ax = plotpress.subplots()
ax.violinplot(data)
ax.set_title("violinplot")
fig.tight_layout()
Total running time of the script: (0 minutes 0.062 seconds)