Note
Go to the end to download the full example code.
Bar hatching
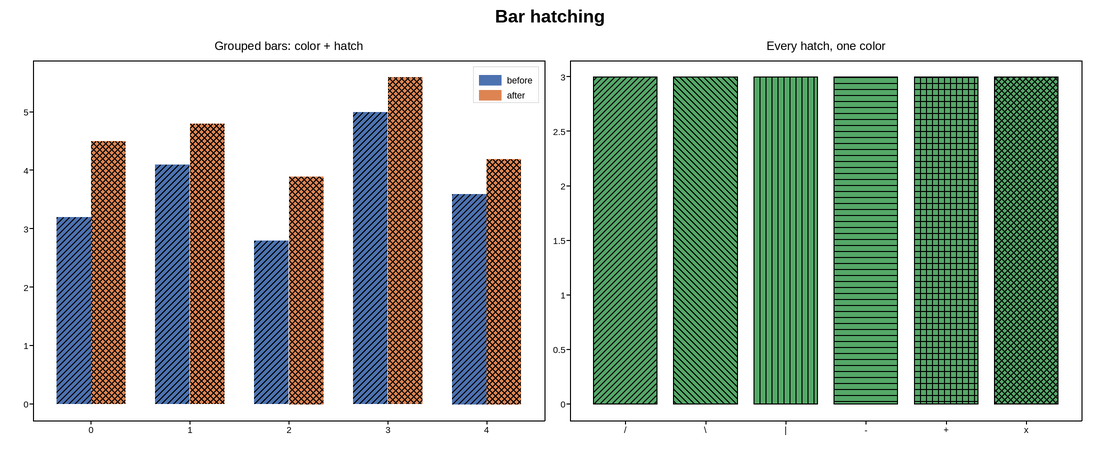
hatch tiles a pattern ("/", "\\", "|", "-", "+",
"x") over a bar’s fill, always in black – the standard way to keep
grouped bars apart in greyscale print or for a colorblind reader, when
color alone can’t. Combine it with color for the best of both: a reader who
can see color still gets it, and one who can’t (or a printed page that
drops it) still can tell every group apart by pattern alone.
Live figure — pick a tool, then zoom, pan, point-pick or annotate. Nothing is active until a tool is selected.
View this figure’s Vega export ↗ — the raw JSON spec, rendered live by a real Vega engine.
View this figure’s Vega-Lite export ↗ — the raw JSON spec(s), rendered live by a real Vega-Lite engine.
import numpy as np
import plotpress

fig, (ax1, ax2) = plotpress.subplots(1, 2, figsize=(11, 4.5))

# -- one hatch per group, color as a bonus, not a requirement ------------
x = np.arange(5)
before = [3.2, 4.1, 2.8, 5.0, 3.6]
after = [4.5, 4.8, 3.9, 5.6, 4.2]
w = 0.35
ax1.bar(x - w / 2, before, width=w, color="#4c72b0", hatch="/", label="before")
ax1.bar(x + w / 2, after, width=w, color="#dd8452", hatch="x", label="after")
ax1.set_xticks(x)
ax1.legend()
ax1.set_title("Grouped bars: color + hatch")

# -- every hatch this library draws, side by side ------------------------
hatches = ["/", "\\", "|", "-", "+", "x"]
for i, h in enumerate(hatches):
    ax2.bar([i], [3], color="#55a868", edgecolor="black", hatch=h)
ax2.set_xticks(range(len(hatches)), hatches)
ax2.set_title("Every hatch, one color")

fig.suptitle("Bar hatching")
fig.tight_layout()
Total running time of the script: (0 minutes 0.134 seconds)