Note
Go to the end to download the full example code.
Broken bar chart (Gantt)
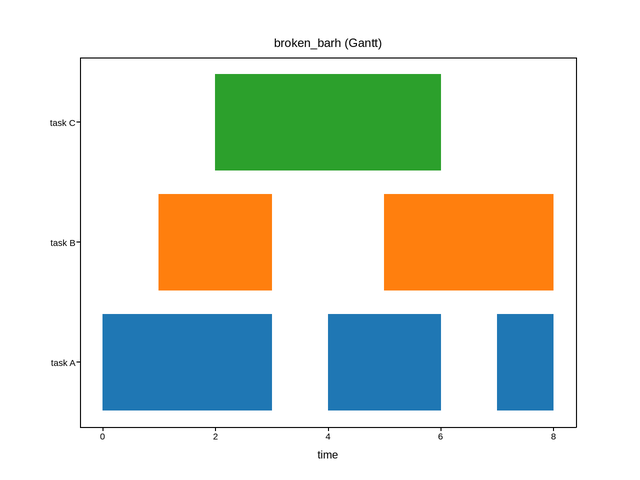
broken_barh draws rows of rectangles from (start, width) spans – handy
for timelines and Gantt charts. Rows are labelled with custom y tick labels.
Live figure — pick a tool, then zoom, pan, point-pick or annotate. Nothing is active until a tool is selected.
View this figure’s Vega export ↗ — the raw JSON spec, rendered live by a real Vega engine.
import plotpress

fig, ax = plotpress.subplots()
ax.broken_barh([(0, 3), (4, 2), (7, 1)], (10, 8), color="#1f77b4")
ax.broken_barh([(1, 2), (5, 3)], (20, 8), color="#ff7f0e")
ax.broken_barh([(2, 4)], (30, 8), color="#2ca02c")

ax.set_yticks([14, 24, 34])
ax.set_yticklabels(["task A", "task B", "task C"])
ax.set_xlabel("time")
ax.set_title("broken_barh (Gantt)")
Total running time of the script: (0 minutes 0.065 seconds)