Note
Go to the end to download the full example code.
Real marker shapes
Shape, not just color, distinguishes scatter/plot markers: round,
square, triangle (four directions), diamond, plus, x/X, and vertical/
horizontal dashes all render as their own real geometry – the standard way
to keep categories apart in greyscale print or for a colorblind reader, when
color alone can’t. An unrecognized marker code still falls back to a round
dot with a warning rather than silently drawing the wrong shape. See
Kaplan-Meier survival curves for "|" used for
its own conventional purpose – a censoring tick on a survival curve.
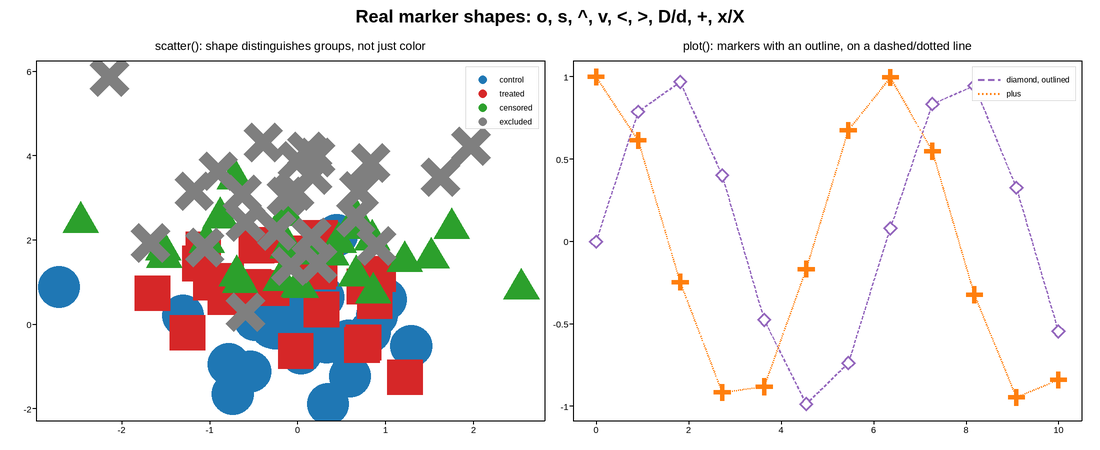
Live figure — pick a tool, then zoom, pan, point-pick or annotate. Nothing is active until a tool is selected.
View this figure’s Vega export ↗ — the raw JSON spec, rendered live by a real Vega engine.
View this figure’s Vega-Lite export ↗ — the raw JSON spec(s), rendered live by a real Vega-Lite engine.
import numpy as np
import plotpress

rng = np.random.default_rng(1)
fig, (ax1, ax2) = plotpress.subplots(1, 2, figsize=(11, 4.5))

# -- categorical data: shape carries the label, color is just a bonus ----
groups = {
    "control": ("o", "#1f77b4"),
    "treated": ("s", "#d62728"),
    "censored": ("^", "#2ca02c"),
    "excluded": ("x", "#7f7f7f"),
}
for name, (marker, color) in groups.items():
    x = rng.normal(size=25)
    y = rng.normal(size=25) + list(groups).index(name)
    ax1.scatter(x, y, marker=marker, s=30, color=color, label=name)
ax1.legend(fontsize=8)
ax1.set_title("scatter(): shape distinguishes groups, not just color")

# -- plot() with markers, edge color/width, and mixed line styles --------
x = np.linspace(0, 10, 12)
ax2.plot(x, np.sin(x), marker="D", markersize=9, linestyle="--",
        color="#9467bd", markerfacecolor="white", markeredgecolor="#9467bd",
        markeredgewidth=1.5, label="diamond, outlined")
ax2.plot(x, np.cos(x), marker="+", markersize=12, linestyle=":",
        color="#ff7f0e", label="plus")
ax2.legend(fontsize=8)
ax2.set_title("plot(): markers with an outline, on a dashed/dotted line")

fig.suptitle("Real marker shapes: o, s, ^, v, <, >, D/d, +, x/X")
fig.tight_layout()
Total running time of the script: (0 minutes 0.153 seconds)