Note
Go to the end to download the full example code.
hlines and vlines
hlines/vlines draw finite line segments at each given position –
hlines(y, xmin, xmax) one horizontal segment per y, vlines(x, ymin,
ymax) one vertical segment per x. Different from axhline/axvline,
which each draw a single line spanning the whole axes: these take arrays and
each segment can start/stop wherever its own xmin/xmax (or
ymin/ymax) say, independent of the others.
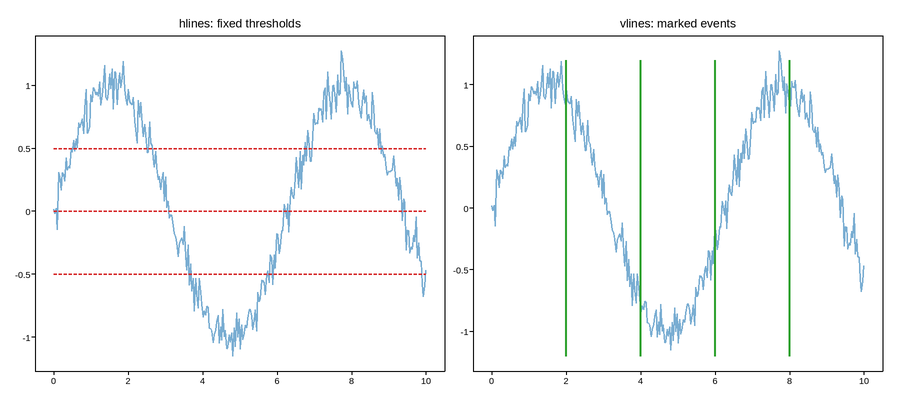
Live figure — pick a tool, then zoom, pan, point-pick or annotate. Nothing is active until a tool is selected.
View this figure’s Vega export ↗ — the raw JSON spec, rendered live by a real Vega engine.
View this figure’s Vega-Lite export ↗ — the raw JSON spec(s), rendered live by a real Vega-Lite engine.
import numpy as np
import plotpress

rng = np.random.default_rng(2)
x = np.linspace(0, 10, 300)
y = np.sin(x) + 0.1 * rng.standard_normal(x.size)

fig, (ax1, ax2) = plotpress.subplots(1, 2, figsize=(9, 4))

ax1.plot(x, y, color="#1f77b4", alpha=0.6)
levels = [-0.5, 0.0, 0.5]
ax1.hlines(levels, xmin=0, xmax=10, color="#d62728", linestyle="--")
ax1.set_title("hlines: fixed thresholds")

ax2.plot(x, y, color="#1f77b4", alpha=0.6)
events = [2, 4, 6, 8]
ax2.vlines(events, ymin=-1.2, ymax=1.2, color="#2ca02c", linewidth=2)
ax2.set_title("vlines: marked events")
fig.tight_layout()
Total running time of the script: (0 minutes 0.121 seconds)