Note
Go to the end to download the full example code.
Line styles
The four dash patterns plot() (and every other line-drawing method –
hlines/vlines/axhline/axvline/axline/errorbar/
Figure.group()) understands, each in both the short form matplotlib
users already know and its equally valid long-form alias – "dashed"
draws the exact same pattern as "--", not a second, different style.
Solid needs no linestyle= at all; it is every method’s own default.
linestyle="none" (and its "None"/""/" " spellings) is a
fifth, distinct case: no connecting line at all, just whatever markers the
call also asked for – matplotlib’s usual way to plot markers alone. Every
line-drawing method honors it, not just errorbar().
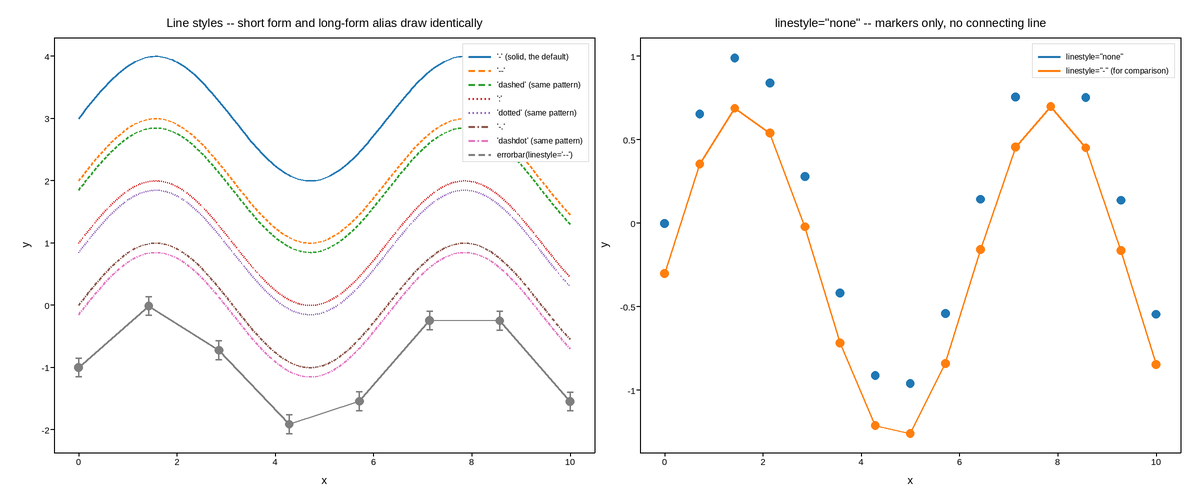
Live figure — pick a tool, then zoom, pan, point-pick or annotate. Nothing is active until a tool is selected.
View this figure’s Vega export ↗ — the raw JSON spec, rendered live by a real Vega engine.
View this figure’s Vega-Lite export ↗ — the raw JSON spec(s), rendered live by a real Vega-Lite engine.
import numpy as np
import plotpress

x = np.linspace(0, 10, 200)
fig, (ax, ax2) = plotpress.subplots(1, 2, figsize=(12, 5))

ax.plot(x, np.sin(x) + 3.0, linestyle="-", label="'-' (solid, the default)")
ax.plot(x, np.sin(x) + 2.0, linestyle="--", label="'--'")
ax.plot(x, np.sin(x) + 2.0 - 0.15, linestyle="dashed", label="'dashed' (same pattern)")
ax.plot(x, np.sin(x) + 1.0, linestyle=":", label="':'")
ax.plot(x, np.sin(x) + 1.0 - 0.15, linestyle="dotted", label="'dotted' (same pattern)")
ax.plot(x, np.sin(x) + 0.0, linestyle="-.", label="'-.'")
ax.plot(x, np.sin(x) + 0.0 - 0.15, linestyle="dashdot", label="'dashdot' (same pattern)")

# The docstring's claim that errorbar() honors linestyle= too, shown rather
# than just stated -- its connecting line takes the same dash patterns as
# plot()'s, independent of the whisker/cap styling.
xe = np.linspace(0, 10, 8)
ax.errorbar(xe, np.sin(xe) - 1.0, yerr=0.15, linestyle="--", capsize=3,
           label="errorbar(linestyle='--')")

ax.set_title("Line styles -- short form and long-form alias draw identically")
ax.set_xlabel("x"); ax.set_ylabel("y")
ax.legend(loc="upper right", fontsize=8)

# linestyle="none": markers only, no connecting line -- distinct from every
# dash pattern above, and distinct from simply omitting a marker=.
xs = np.linspace(0, 10, 15)
ax2.plot(xs, np.sin(xs), linestyle="none", marker="o", label='linestyle="none"')
ax2.plot(xs, np.sin(xs) - 0.3, linestyle="-", marker="o", label='linestyle="-" (for comparison)')
ax2.axhline(-1.3, linestyle="none")   # draws nothing at all -- no marker to fall back to
ax2.set_title('linestyle="none" -- markers only, no connecting line')
ax2.set_xlabel("x"); ax2.set_ylabel("y")
ax2.legend(loc="upper right", fontsize=8)

fig.tight_layout()
Total running time of the script: (0 minutes 0.181 seconds)