Note
Go to the end to download the full example code.
Filled area
fill_between fills vertically, between a curve and a baseline at each
x; fill_betweenx is its transpose – filling horizontally, between a
curve and a baseline at each y. edgecolor/linewidth outline the
filled region – the same two options fill() already has.
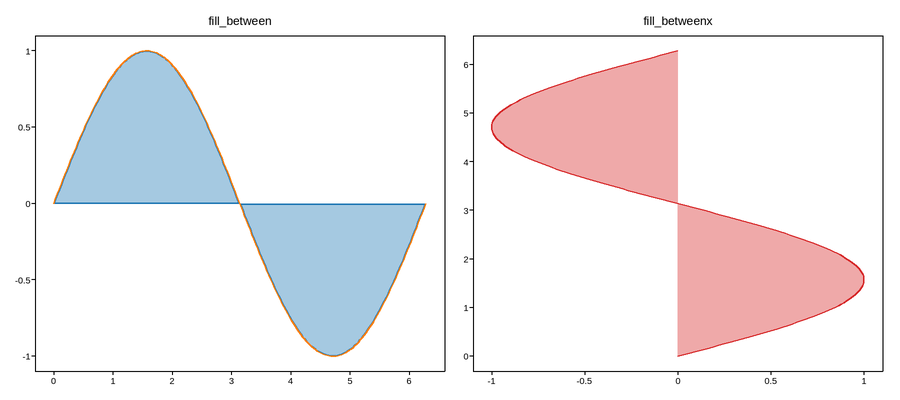
Live figure — pick a tool, then zoom, pan, point-pick or annotate. Nothing is active until a tool is selected.
View this figure’s Vega export ↗ — the raw JSON spec, rendered live by a real Vega engine.
View this figure’s Vega-Lite export ↗ — the raw JSON spec(s), rendered live by a real Vega-Lite engine.
import numpy as np
import plotpress

x = np.linspace(0, 2 * np.pi, 200)
y = np.sin(x)

fig, (ax1, ax2) = plotpress.subplots(1, 2, figsize=(9, 4))

ax1.fill_between(x, y, 0.0, alpha=0.4, edgecolor="#1f77b4", linewidth=1.5)
ax1.plot(x, y)
ax1.set_title("fill_between")

ax2.fill_betweenx(x, y, 0.0, alpha=0.4, color="#d62728")
ax2.plot(y, x, color="#d62728")
ax2.set_title("fill_betweenx")
fig.tight_layout()
Total running time of the script: (0 minutes 0.094 seconds)