Note
Go to the end to download the full example code.
Log-log, semilog-x and semilog-y axes
loglog logs both axes; semilogx/semilogy log only one – each is
a thin wrapper that sets the one scale and plots, for the common case of one
exponential/power-law axis paired with one linear one.
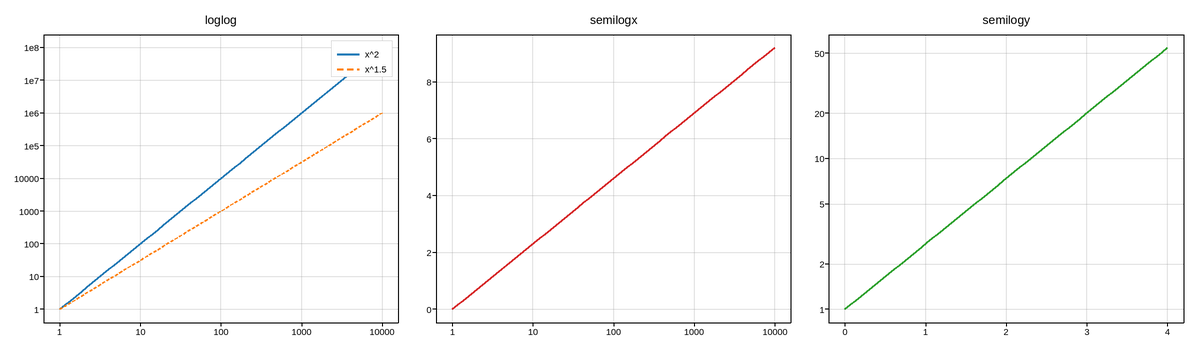
Live figure — pick a tool, then zoom, pan, point-pick or annotate. Nothing is active until a tool is selected.
View this figure’s Vega export ↗ — the raw JSON spec, rendered live by a real Vega engine.
View this figure’s Vega-Lite export ↗ — the raw JSON spec(s), rendered live by a real Vega-Lite engine.
import numpy as np
import plotpress

x = np.logspace(0, 4, 60)

fig, (ax1, ax2, ax3) = plotpress.subplots(1, 3, figsize=(12, 3.5))

ax1.loglog(x, x ** 2, label="x^2")
ax1.loglog(x, x ** 1.5, linestyle="--", label="x^1.5")
ax1.set_title("loglog"); ax1.grid(True); ax1.legend()

ax2.semilogx(x, np.log(x), color="#d62728")
ax2.set_title("semilogx"); ax2.grid(True)

y = np.linspace(0, 4, 60)
ax3.semilogy(y, np.exp(y), color="#2ca02c")
ax3.set_title("semilogy"); ax3.grid(True)
fig.tight_layout()
Total running time of the script: (0 minutes 0.100 seconds)