Note
Go to the end to download the full example code.
Kaplan-Meier survival curves
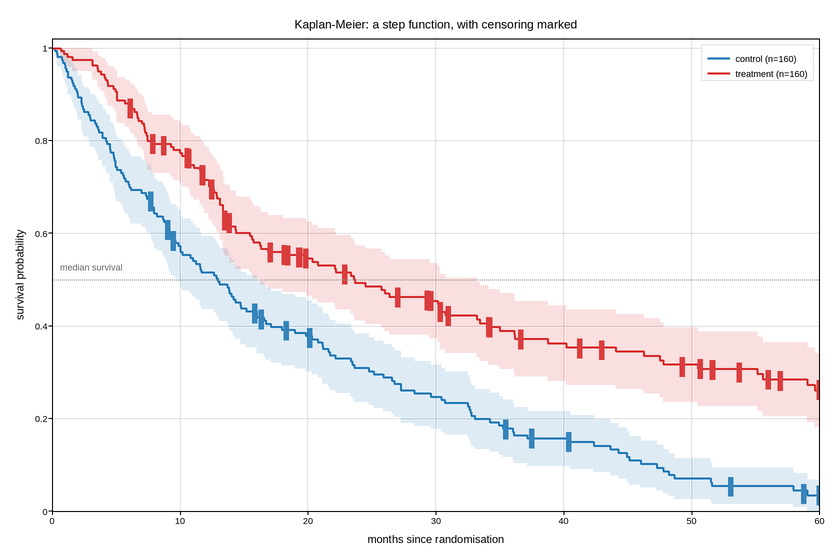
Survival probability against time for two treatment arms of a clinical trial.
The estimator is a step function by construction – it only changes at the
instants events occur, and asserts nothing in between – so it must be drawn
with step, never with plot. Connecting the estimates with straight lines
would claim a smooth decline the data does not support, and would put the curve
below the true estimate for the whole interval between events.
where="post" is the correct step convention: the survival probability holds
its value from one event until the next, then drops. The alternatives are not a
matter of taste; they shift every drop by one interval.
Censoring is the other half of the method. Patients who leave the study alive carry information – they survived up to their last visit – and the estimator uses it, but they are not events. They are marked with ticks on the curve so a reader can see how much of the late tail rests on very few remaining patients, which is where these curves are least trustworthy and most over-interpreted.
The shaded bands are pointwise confidence intervals, drawn with fill_between
using step-shaped inputs so the band’s edges follow the curve rather than
cutting corners across it.
Live figure — pick a tool, then zoom, pan, point-pick or annotate. Nothing is active until a tool is selected.
View this figure’s Vega export ↗ — the raw JSON spec, rendered live by a real Vega engine.
View this figure’s Vega-Lite export ↗ — the raw JSON spec(s), rendered live by a real Vega-Lite engine.
import numpy as np
import polars as pl
import plotpress

rng = np.random.default_rng(1958)


def kaplan_meier(times, events):
    """Return (t, S, var_term) at each distinct event time, plus a t=0 origin."""
    order = np.argsort(times)
    times, events = times[order], events[order]
    n = times.size
    at_risk = n - np.arange(n)
    event_times = np.unique(times[events == 1])

    t_out, s_out, cum = [0.0], [1.0], [0.0]
    s = 1.0
    running = 0.0
    for et in event_times:
        d = int(((times == et) & (events == 1)).sum())
        r = int(at_risk[np.searchsorted(times, et)])
        s *= (1.0 - d / r)
        running += d / (r * (r - d)) if r > d else 0.0
        t_out.append(et)
        s_out.append(s)
        cum.append(running)
    return np.array(t_out), np.array(s_out), np.array(cum)


ARMS = [("control", 14.0, "#1f77b4"), ("treatment", 26.0, "#d62728")]
N_PER_ARM = 160
FOLLOW_UP = 60.0                                   # months

fig, ax = plotpress.subplots(figsize=(8.4, 5.6))

for name, median, color in ARMS:
    survival_time = rng.exponential(median / np.log(2.0), N_PER_ARM)
    dropout_time = rng.uniform(6.0, 1.8 * FOLLOW_UP, N_PER_ARM)

    # One row per randomised patient -- the shape a trial's own case report
    # forms are in, before the Kaplan-Meier estimator is computed from them.
    cohort = pl.DataFrame({
        "observed": np.minimum(np.minimum(survival_time, dropout_time), FOLLOW_UP),
        "event": (survival_time <= np.minimum(dropout_time, FOLLOW_UP)).astype(int),
    })
    observed = cohort["observed"].to_numpy()
    events = cohort["event"].to_numpy()

    t, s, cum = kaplan_meier(observed, events)
    # Greenwood's formula for the pointwise standard error.
    se = s * np.sqrt(cum)
    lo, hi = np.clip(s - 1.96 * se, 0.0, 1.0), np.clip(s + 1.96 * se, 0.0, 1.0)

    # Repeat each value so fill_between traces the same staircase as step().
    tt = np.repeat(np.append(t, FOLLOW_UP), 2)[1:-1]
    ax.fill_between(tt, np.repeat(lo, 2), np.repeat(hi, 2), color=color,
                    alpha=0.15)
    ax.step(np.append(t, FOLLOW_UP), np.append(s, s[-1]), where="post",
            color=color, linewidth=1.8, label=f"{name} (n={N_PER_ARM})")

    # Censoring ticks -- conventionally a vertical dash straddling the curve,
    # which is exactly what the "|" marker draws.
    censored = observed[events == 0]
    height = np.interp(censored, t, s)
    ax.scatter(censored, height, marker="|", s=14, color=color, alpha=0.9)

ax.axhline(0.5, color="#888888", linestyle=":", linewidth=1.2)
ax.text(0.6, 0.52, "median survival", fontsize=9, color="#666666")

ax.set_xlim(0.0, FOLLOW_UP)
ax.set_ylim(0.0, 1.02)
ax.set_xlabel("months since randomisation")
ax.set_ylabel("survival probability")
ax.set_title("Kaplan-Meier: a step function, with censoring marked")
ax.legend(loc="upper right")
ax.grid(True)
fig.tight_layout()
Total running time of the script: (0 minutes 0.216 seconds)