Chemistry and spectroscopy
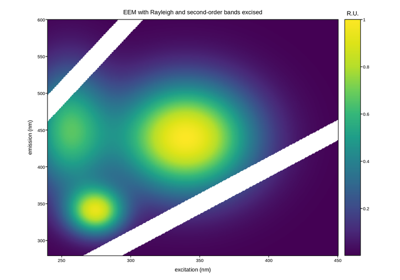
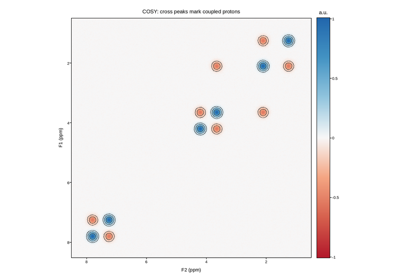
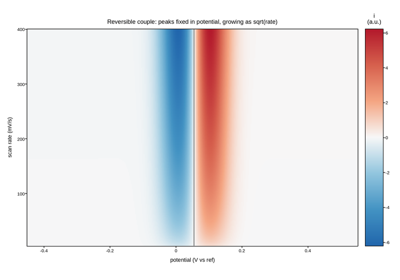
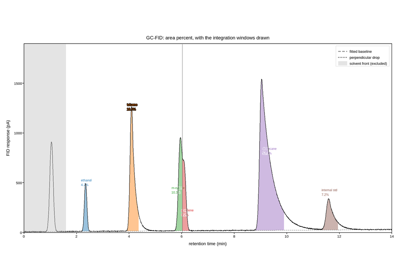
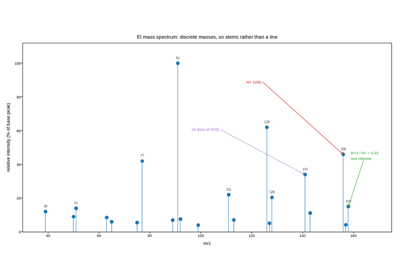
Separations, spectra, correlation maps and electrochemistry. Spectroscopy has strong plotting conventions that are worth honouring even though they look backwards – infrared runs right to left in wavenumber, NMR runs backwards in ppm, transmittance is read downward – and the examples show how to get them with axis inversion rather than by pre-flipping the data.
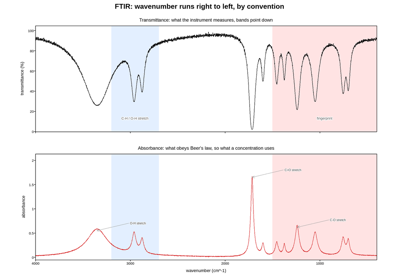
Infrared spectrum with the conventional reversed axes
Infrared spectrum with the conventional reversed axes
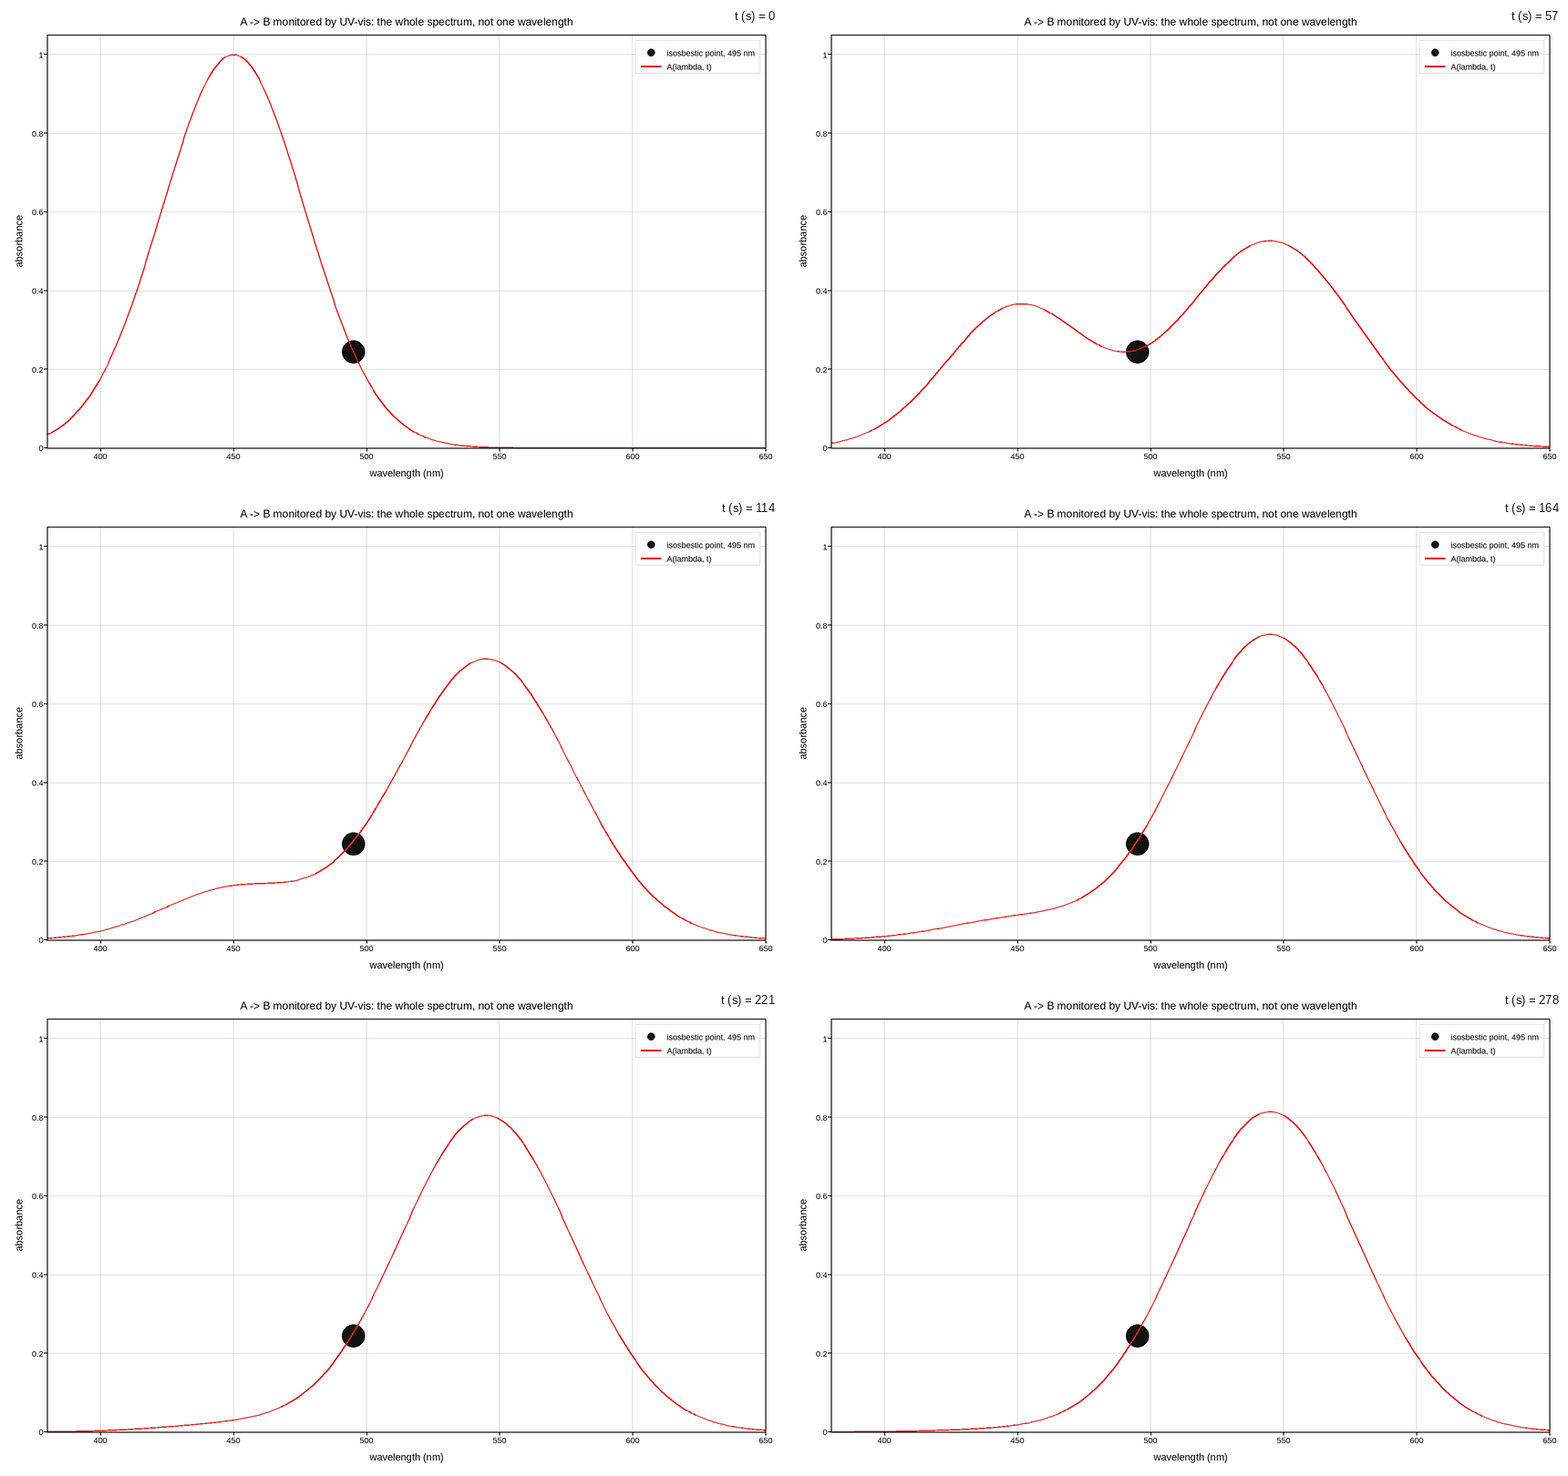
UV-vis spectrum through a first-order reaction, animated
UV-vis spectrum through a first-order reaction, animated