Manufacturing, reliability and quality

Control charts, capability studies, Pareto analysis, life-test fitting and production scheduling. These are the figures where the reference lines carry the decision – control limits, specification limits, a cumulative 80% cut – so most of the work is making the limits unmistakable against the data rather than drawing the data itself.
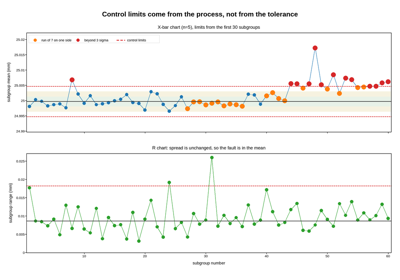
X-bar and R control chart

X-bar and R control chart

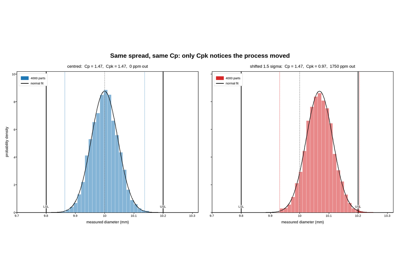
Process capability against specification limits

Process capability against specification limits

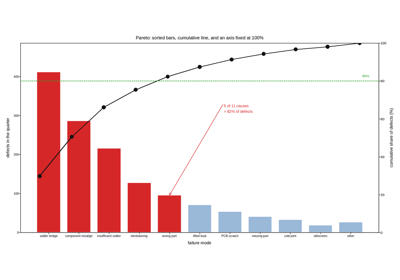
Pareto chart of defect causes

Pareto chart of defect causes

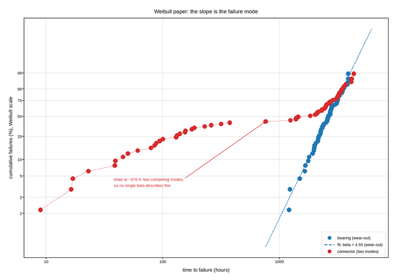
Weibull probability plot of a life test

Weibull probability plot of a life test

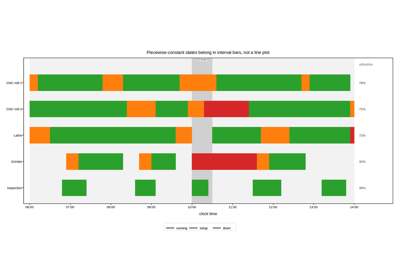
Machine utilisation over a shift

Machine utilisation over a shift

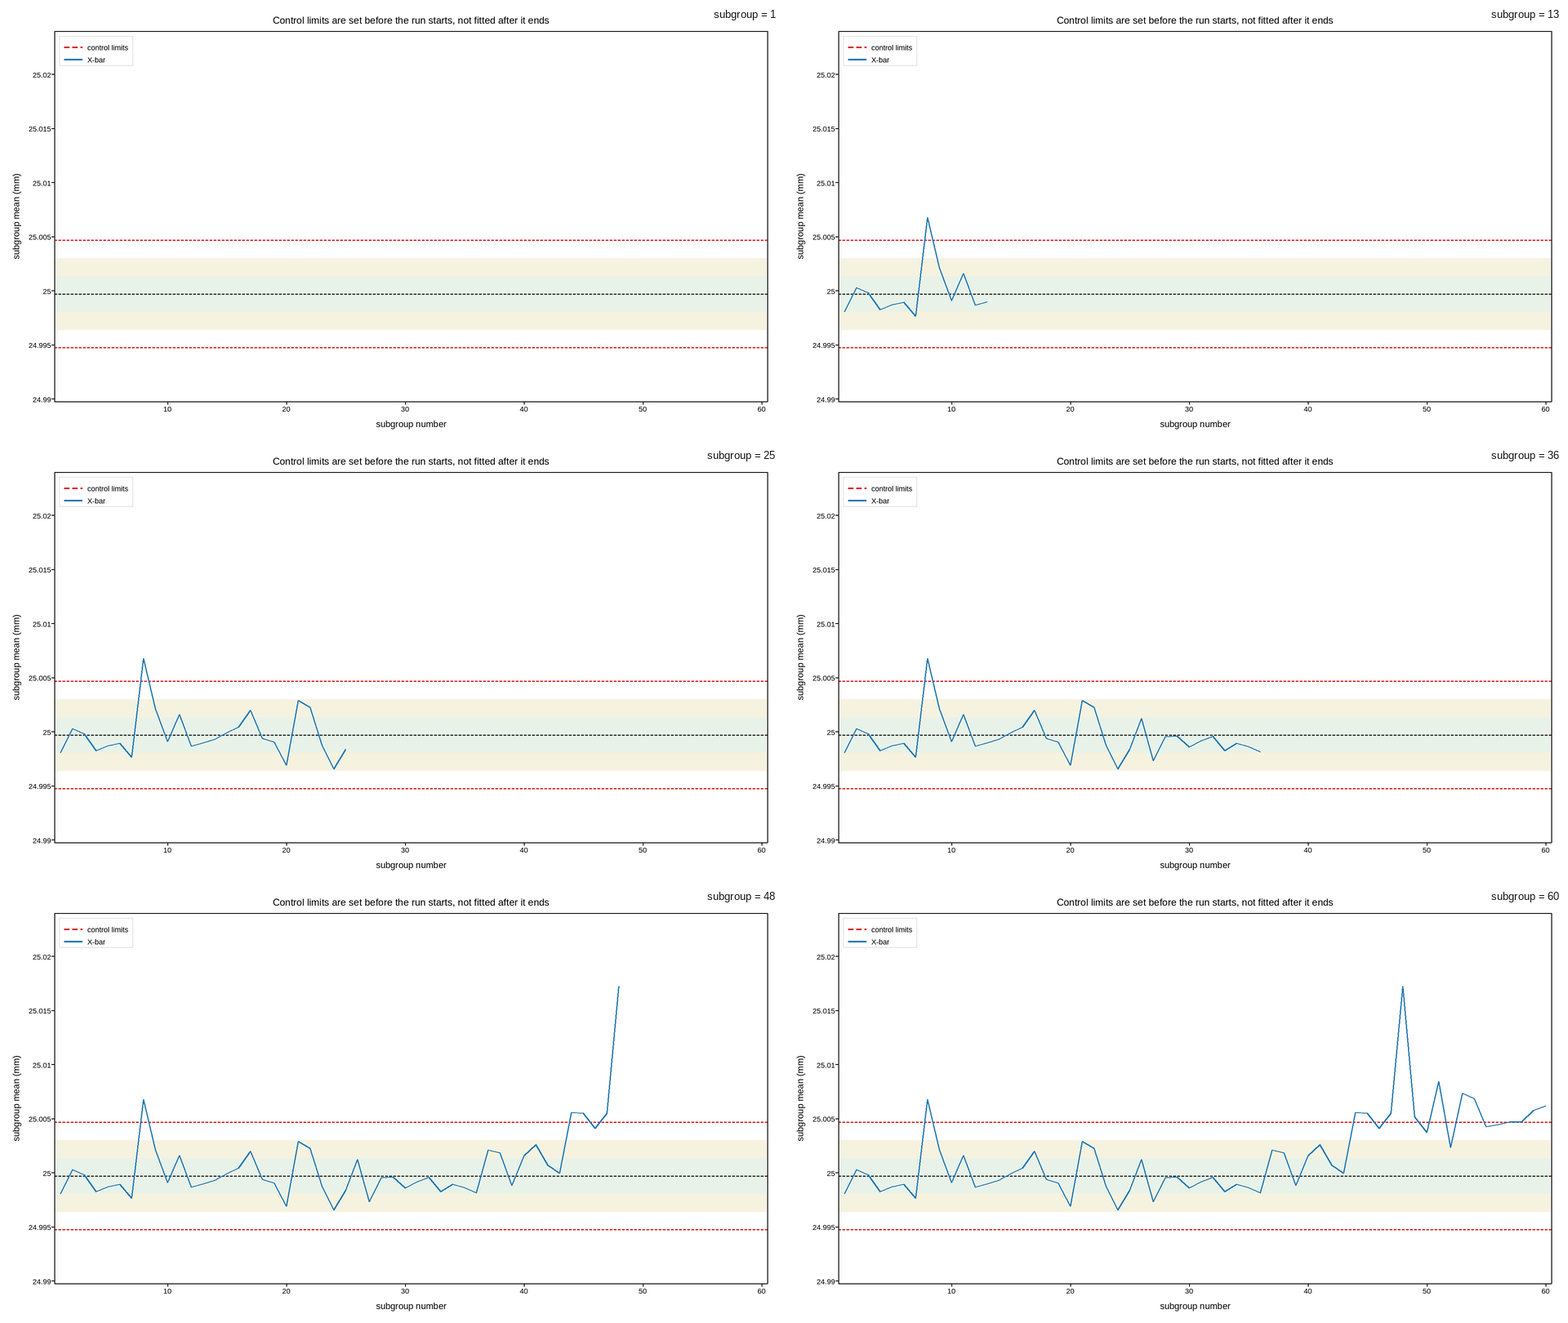
A control chart, revealed subgroup by subgroup

A control chart, revealed subgroup by subgroup