Note
Go to the end to download the full example code.
X-bar and R control chart
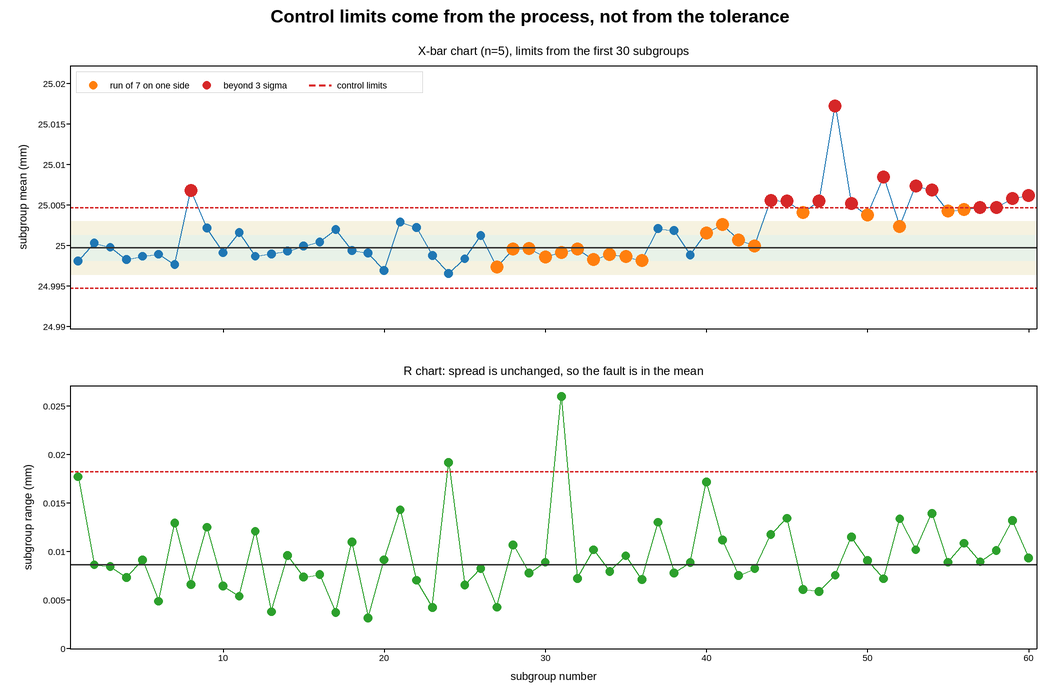
The pair of charts a process is monitored with: subgroup means on top, subgroup ranges below. They share the x axis because they are two views of the same sampling sequence, and they must be read together – a shift in the mean and a change in the spread are different faults with different causes, and a mean chart alone cannot tell them apart.
Control limits are not specification limits. They are computed from the process’s own short-term variation (the mean range, scaled by the standard constants) and describe what this process does when nothing is wrong. Drawing them from the data rather than from the drawing tolerance is the entire idea of statistical process control, and it is why the limits here are calculated in the code rather than passed in.
The chart is read by rule, not by eye, so the violations are marked by rule: a point outside three sigma, and a run of seven consecutive points on one side of the centre line. The second rule catches exactly what this process does – a slow tool-wear drift that never puts a single point outside the limits but is unmistakable as a run. Marking the two rules differently is what makes the figure a decision aid rather than a picture.
The one-sigma and two-sigma zones are shaded, because most of the additional run rules are stated in terms of them.
Live figure — pick a tool, then zoom, pan, point-pick or annotate. Nothing is active until a tool is selected.
View this figure’s Vega export ↗ — the raw JSON spec, rendered live by a real Vega engine.
View this figure’s Vega-Lite export ↗ — the raw JSON spec(s), rendered live by a real Vega-Lite engine.
import numpy as np
import polars as pl
import plotpress

rng = np.random.default_rng(1924)

SUBGROUP = 5                                       # parts measured per subgroup
N_GROUPS = 60
TARGET = 25.000                                    # mm
SIGMA = 0.0042

# Constants for n=5 subgroups (Shewhart's tables).
A2, D3, D4, D2 = 0.577, 0.0, 2.114, 2.326

parts = rng.normal(TARGET, SIGMA, (N_GROUPS, SUBGROUP))
# A tool-wear drift starting at subgroup 34: never a single wild point, but a
# long run above the centre line.
drift = np.clip(np.arange(N_GROUPS) - 34, 0.0, None) * 0.00028
parts += drift[:, None]
# One genuine outlier: a subgroup with a loose fixture.
parts[47] += 0.0135

groups = np.arange(1, N_GROUPS + 1)

# One row per part measured -- the shape a gauge's own measurement log is in,
# before it is aggregated into a subgroup mean and range.
measurements = pl.DataFrame({"group": np.repeat(groups, SUBGROUP), "value": parts.ravel()})
subgroups = measurements.group_by("group", maintain_order=True).agg(
    pl.col("value").mean().alias("xbar"),
    (pl.col("value").max() - pl.col("value").min()).alias("range"),
)
xbar = subgroups["xbar"].to_numpy()
rng_bar = subgroups["range"].to_numpy()

# Limits from the first 30 subgroups, before the process drifted -- estimating
# them from data that already contains the fault widens them until the fault fits.
BASE = slice(0, 30)
centre_x = xbar[BASE].mean()
centre_r = rng_bar[BASE].mean()
ucl_x, lcl_x = centre_x + A2 * centre_r, centre_x - A2 * centre_r
ucl_r, lcl_r = D4 * centre_r, D3 * centre_r
sigma_hat = centre_r / (D2 * np.sqrt(SUBGROUP))

# Rule 1: outside the control limits. Rule 2: seven in a row on one side.
beyond = (xbar > ucl_x) | (xbar < lcl_x)
side = np.sign(xbar - centre_x)
run = np.zeros(N_GROUPS, dtype=bool)
for i in range(6, N_GROUPS):
    if abs(side[i - 6:i + 1].sum()) == 7:
        run[i - 6:i + 1] = True

fig, axes = plotpress.subplots(2, 1, figsize=(10.6, 7.0), sharex=True)
ax_x, ax_r = axes

for k, shade in [(1, "#e8f2e8"), (2, "#f6f2e0")]:
    ax_x.axhspan(centre_x + (k - 1) * sigma_hat, centre_x + k * sigma_hat,
                 color=shade, alpha=1.0)
    ax_x.axhspan(centre_x - k * sigma_hat, centre_x - (k - 1) * sigma_hat,
                 color=shade, alpha=1.0)

ax_x.plot(groups, xbar, color="#1f77b4", linewidth=1.2)
ax_x.scatter(groups, xbar, s=6.0, color="#1f77b4")
ax_x.scatter(groups[run & ~beyond], xbar[run & ~beyond], s=9.0, color="#ff7f0e",
             label="run of 7 on one side")
ax_x.scatter(groups[beyond], xbar[beyond], s=9.0, color="#d62728",
             label="beyond 3 sigma")
ax_x.axhline(centre_x, color="#333333", linewidth=1.3, linestyle="-")
ax_x.axhline(ucl_x, color="#d62728", linewidth=1.3, linestyle="--", label="control limits")
ax_x.axhline(lcl_x, color="#d62728", linewidth=1.3, linestyle="--")
ax_x.set_ylim(lcl_x - 3 * sigma_hat, xbar.max() + 3 * sigma_hat)
ax_x.set_ylabel("subgroup mean (mm)")
ax_x.set_title(f"X-bar chart (n={SUBGROUP}), limits from the first 30 subgroups")
ax_x.legend(loc="upper left", ncol=3)

ax_r.plot(groups, rng_bar, color="#2ca02c", linewidth=1.2)
ax_r.scatter(groups, rng_bar, s=6.0, color="#2ca02c")
ax_r.axhline(centre_r, color="#333333", linewidth=1.3, linestyle="-")
ax_r.axhline(ucl_r, color="#d62728", linewidth=1.3, linestyle="--")
ax_r.set_ylim(0.0, None)
ax_r.set_xlim(0.5, N_GROUPS + 0.5)
ax_r.set_xlabel("subgroup number")
ax_r.set_ylabel("subgroup range (mm)")
ax_r.set_title("R chart: spread is unchanged, so the fault is in the mean")

fig.suptitle("Control limits come from the process, not from the tolerance")
fig.tight_layout()
Total running time of the script: (0 minutes 0.160 seconds)