Computing, networks and machine learning
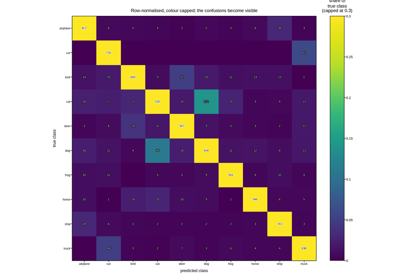
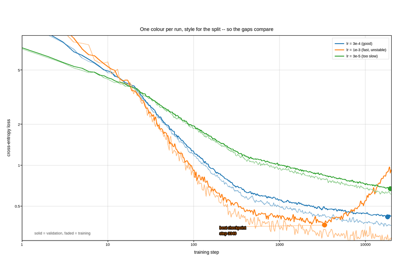
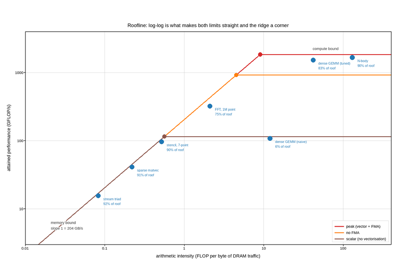
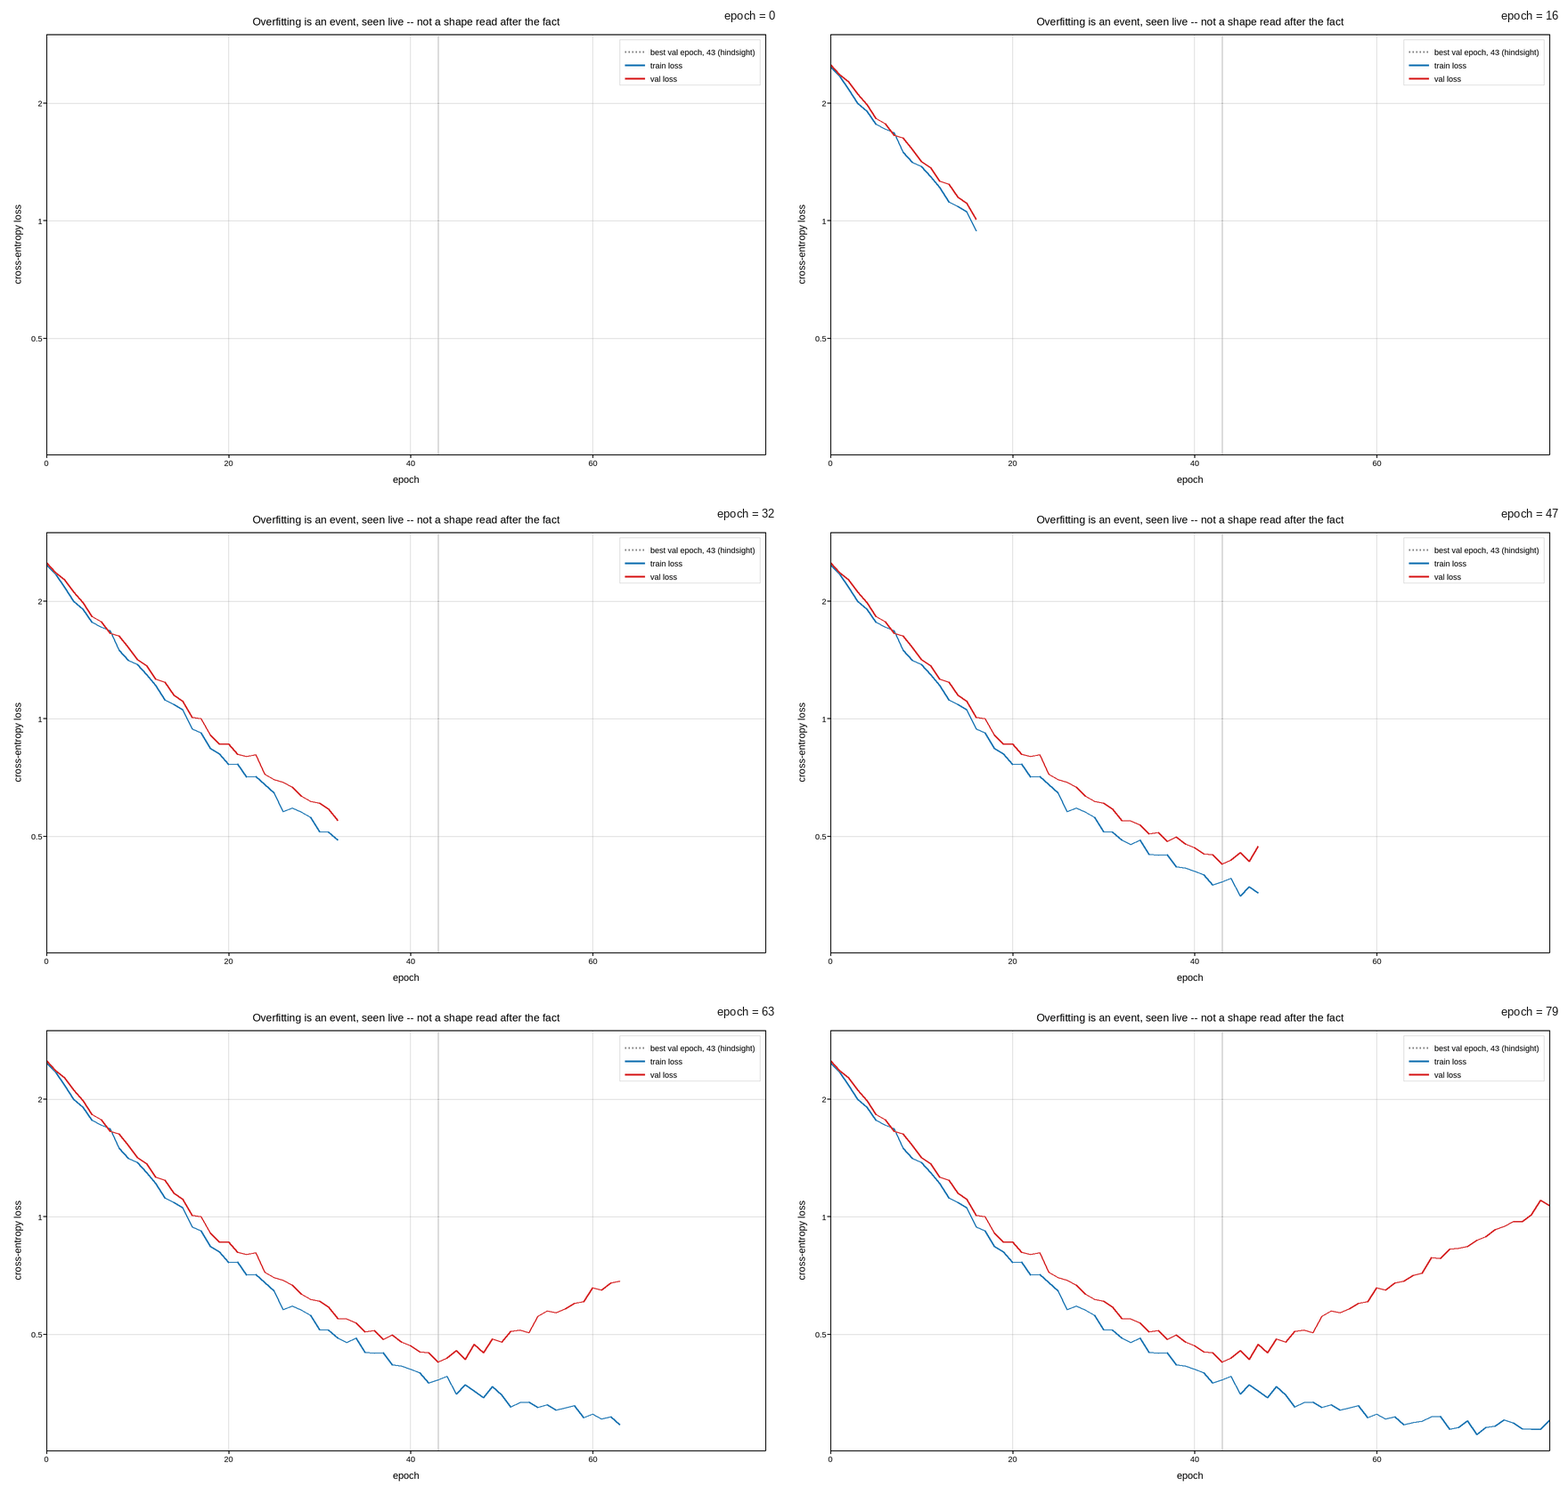
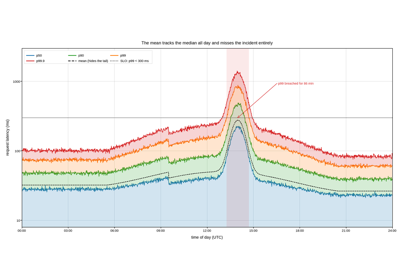
Service latency, classifier evaluation, training diagnostics and hardware performance models. Systems data is heavy-tailed almost by definition, which is why the tail percentile rather than the mean is plotted, and why the roofline and scaling charts are log-log: the interesting behaviour is a change of slope, and only a log axis makes a slope change visible.
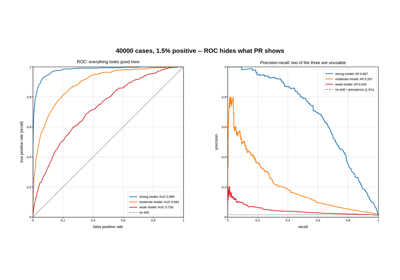
ROC and precision-recall for an imbalanced problem
ROC and precision-recall for an imbalanced problem