Note
Go to the end to download the full example code.
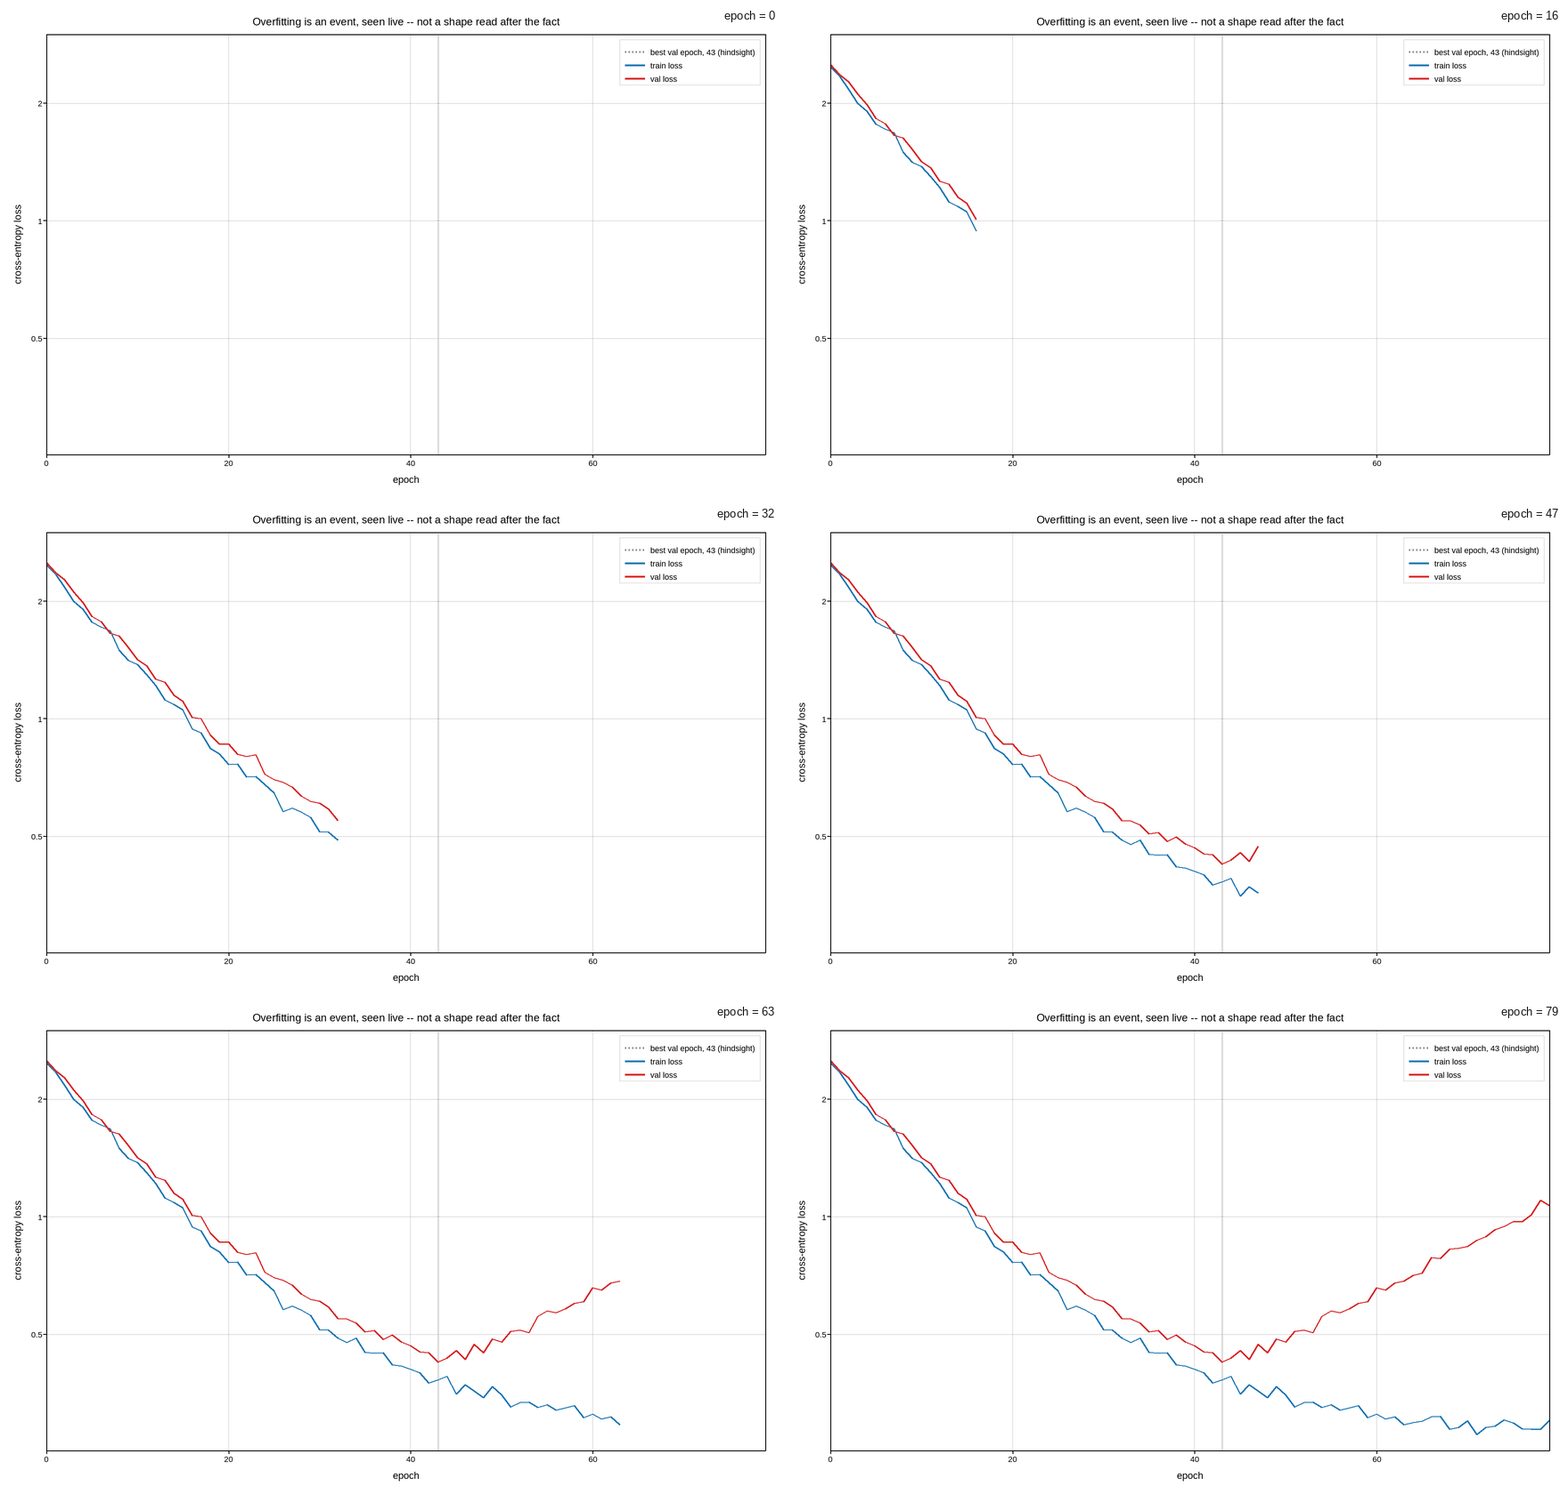
A training run, revealed epoch by epoch
The same loss-curve data as Training curves for three learning rates, watched the way
it actually arrives at a terminal: one epoch at a time, live, with no
foreknowledge of where the run is headed. ax.plot_frames() is normally
used to scrub a parameter that already exists in full; here it does
something slightly different – each frame reveals one more epoch of the
same run, the unrevealed epochs held at nan so the line simply stops
where the data does, rather than snapping between unrelated curves.
Watching the reveal is a different read from seeing the finished plot. Only partway through does it become visible that training loss keeps falling smoothly while validation loss peels away and starts climbing – overfitting as an event happening at a moment, not a shape read off a completed curve after the fact. The vertical line marks the best validation epoch, in hindsight; nothing at the time the run reached it says stop here, which is exactly why early stopping needs a rule rather than a glance.
Live figure — pick a tool, then zoom, pan, point-pick or annotate. Nothing is active until a tool is selected.
View this figure’s Vega export ↗ — the raw JSON spec, rendered live by a real Vega engine.
View this figure’s Vega-Lite export ↗ — the raw JSON spec(s), rendered live by a real Vega-Lite engine.
import os
import tempfile

import numpy as np
import polars as pl
import plotpress

rng = np.random.default_rng(7)

N_EPOCHS = 80
FLOOR = 0.28
OVERFIT_ONSET = 42

epoch = np.arange(N_EPOCHS)
train_loss = FLOOR + 2.2 * np.exp(-epoch / 14.0)
train_loss *= np.exp(rng.normal(0.0, 0.03, N_EPOCHS))

val_loss = FLOOR + 0.06 + 2.2 * np.exp(-epoch / 14.0)
val_loss += 0.55 * np.clip((epoch - OVERFIT_ONSET) / 30.0, 0.0, None) ** 1.4
val_loss *= np.exp(rng.normal(0.0, 0.025, N_EPOCHS))

# One row per epoch actually logged -- the shape a training run's own
# metrics stream is in, before it is revealed one epoch at a time below.
log = pl.DataFrame({"epoch": epoch, "train_loss": train_loss, "val_loss": val_loss})
epoch = log["epoch"].to_numpy()
train_loss = log["train_loss"].to_numpy()
val_loss = log["val_loss"].to_numpy()
best_epoch = int(log.sort("val_loss").row(0, named=True)["epoch"])

# Frame f reveals epochs 0..f; the rest are nan, so plot_frames' line simply
# has not been drawn there yet, rather than jumping between curves.
revealed_train = np.full((N_EPOCHS, N_EPOCHS), np.nan)
revealed_val = np.full((N_EPOCHS, N_EPOCHS), np.nan)
for f in range(N_EPOCHS):
    revealed_train[f, :f + 1] = train_loss[:f + 1]
    revealed_val[f, :f + 1] = val_loss[:f + 1]

fig, ax = plotpress.subplots(figsize=(8.8, 5.6))
ax.axvline(best_epoch, color="#888888", linestyle=":", linewidth=1.2,
          label=f"best val epoch, {best_epoch} (hindsight)")
ax.plot_frames(epoch, revealed_train, slider_values=epoch, slider_label="epoch",
              color="#1f77b4", alpha=0.6, label="train loss")
ax.plot_frames(epoch, revealed_val, slider_values=epoch, slider_label="epoch",
              color="#d62728", label="val loss")
ax.set_yscale("log")
ax.set_xlim(0, N_EPOCHS - 1)
ax.set_ylim(FLOOR * 0.9, 3.0)
ax.set_xlabel("epoch")
ax.set_ylabel("cross-entropy loss")
ax.set_title("Overfitting is an event, seen live -- not a shape read after the fact")
ax.legend(loc="upper right")
ax.grid(True)
fig.tight_layout()

gif_path = os.path.join(tempfile.gettempdir(), "plotpress_training_curve_live.gif")
fig.save(gif_path, fps=12)
Total running time of the script: (0 minutes 16.176 seconds)