Energy and power systems

Photovoltaic and wind characterisation, battery ageing, and the load and generation curves a grid operator plans against. The distinctive plotting need is showing two quantities that share an x axis but nothing else – current and power, capacity and efficiency – and showing composition over time without losing the total.
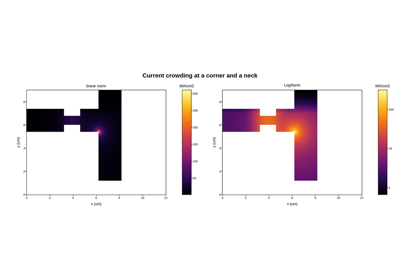
Interconnect current density (LogNorm)

Interconnect current density (LogNorm)

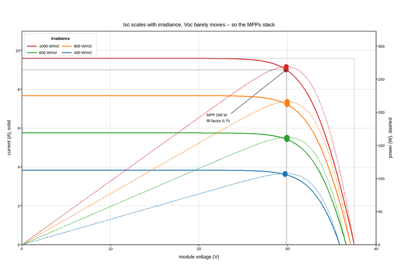
Photovoltaic I-V and power curves

Photovoltaic I-V and power curves

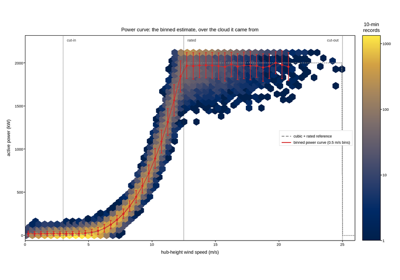
Wind turbine power curve from SCADA data

Wind turbine power curve from SCADA data

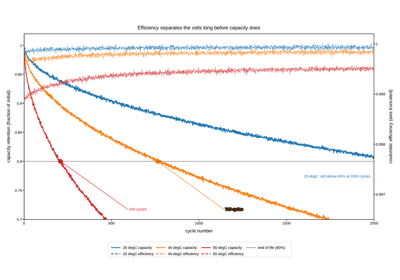
Battery capacity fade and coulombic efficiency

Battery capacity fade and coulombic efficiency

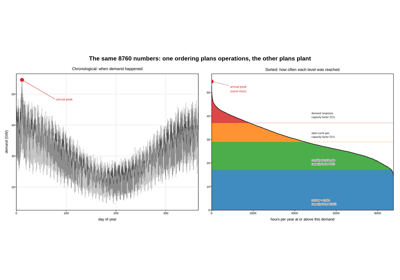
Load duration curve and the generation stack

Load duration curve and the generation stack

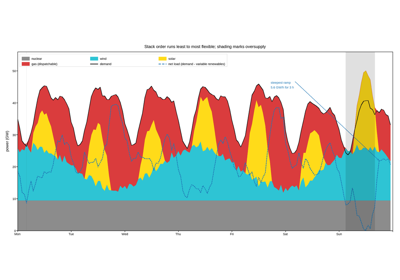
Generation mix over a week, and net load

Generation mix over a week, and net load

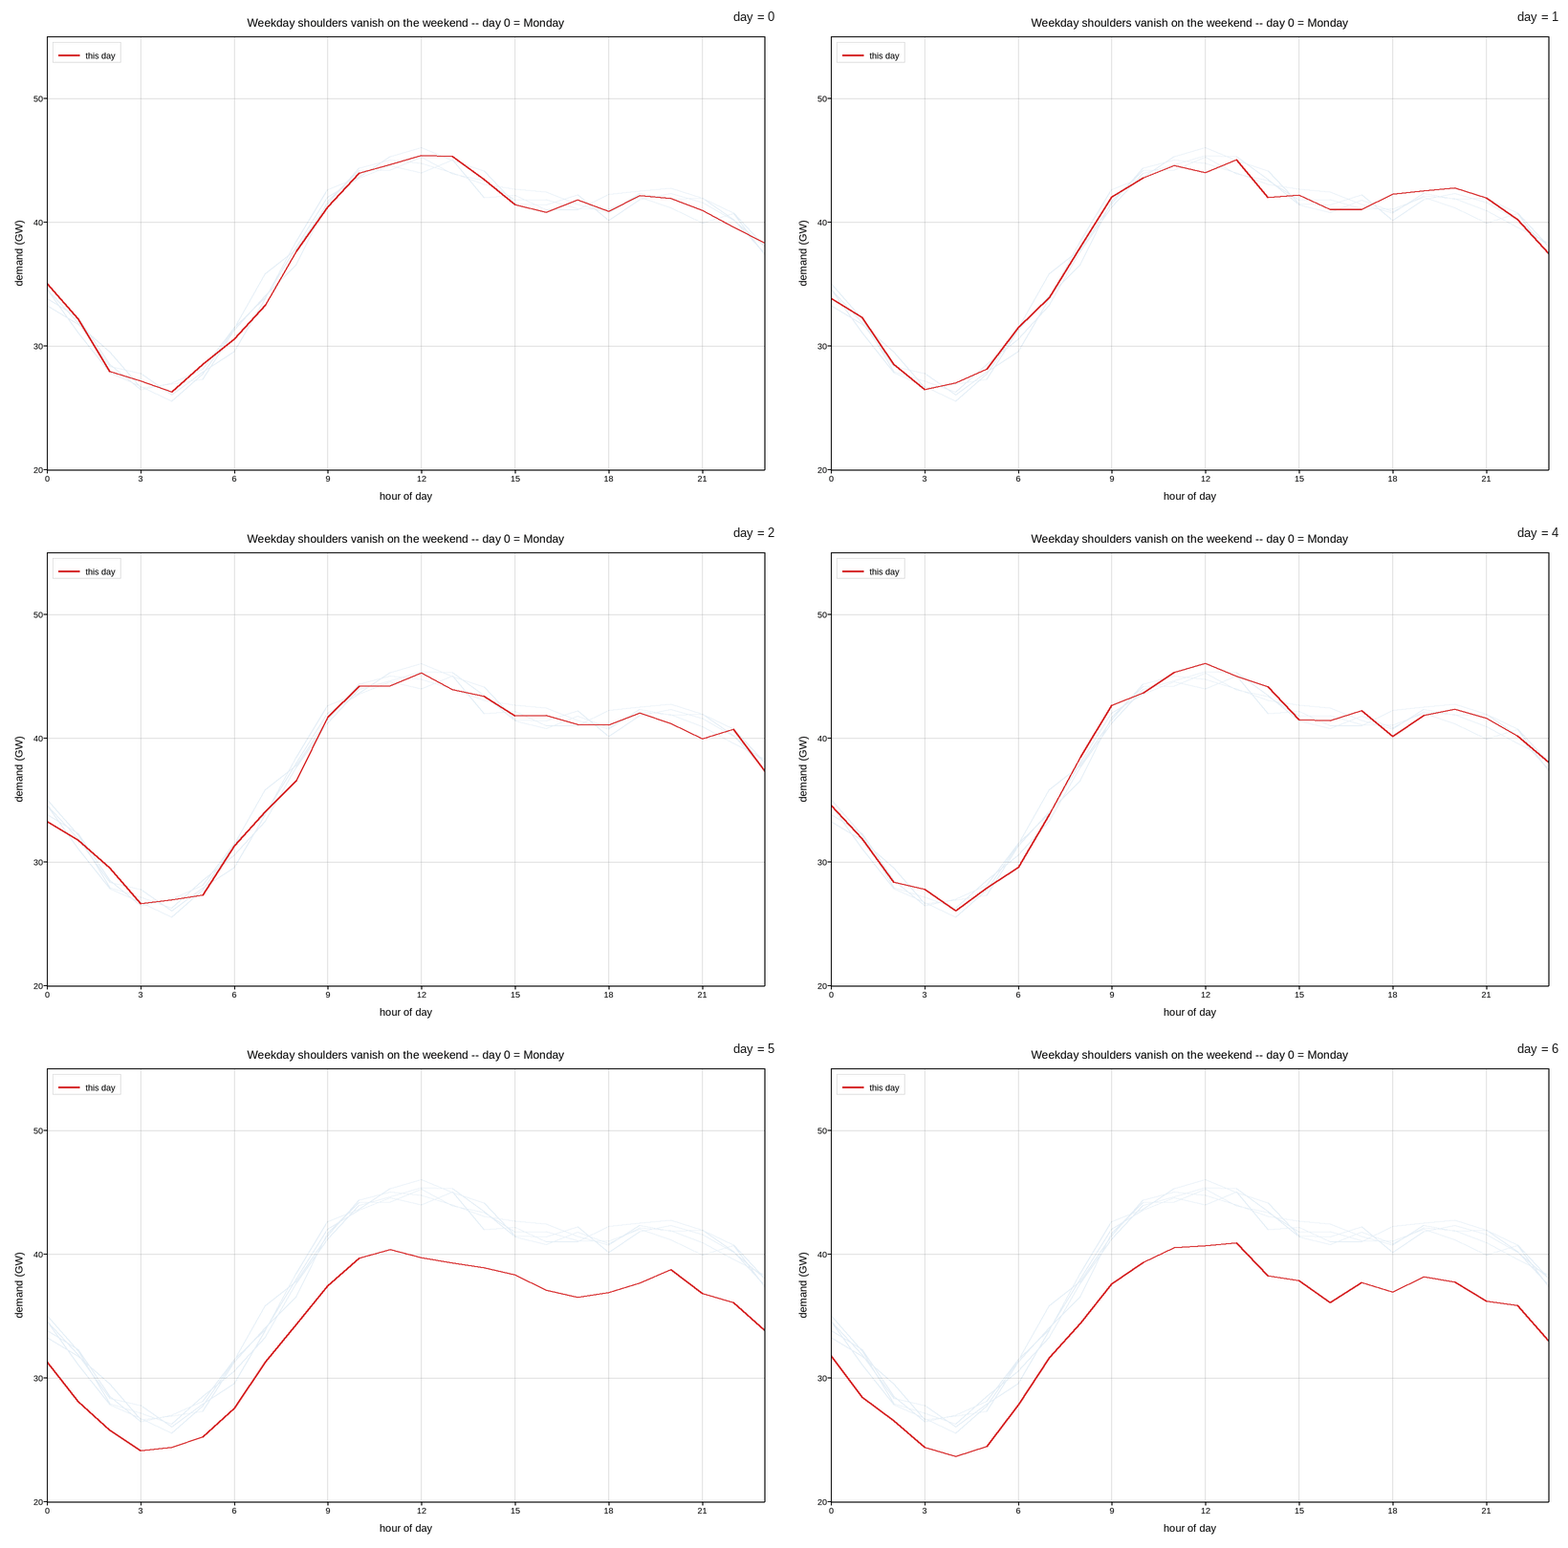
A week of daily load curves, one day per frame

A week of daily load curves, one day per frame