Note
Go to the end to download the full example code.
A week of daily load curves, one day per frame
The same double-peaked demand shape from Generation mix over a week, and net load, isolated to one day at a time and stepped through a full week. A week-long time series answers “what did the grid do”; this animation answers a narrower question a week-long line plot answers only by careful side-by-side comparison – does the shape of a day change between weekdays and the weekend, once the days are overlaid on the same 24-hour axis instead of laid out end to end.
It does. The two weekday peaks – morning ramp-up, evening peak as solar fades and household demand rises – barely move night to night, while Saturday and Sunday sit visibly lower and flatter, missing the sharp morning shoulder that a working day’s fixed start time produces. Freezing the y axis across every frame is what makes that comparison fair: an axis that rescaled to each day’s own range would hide the very difference the animation exists to show.
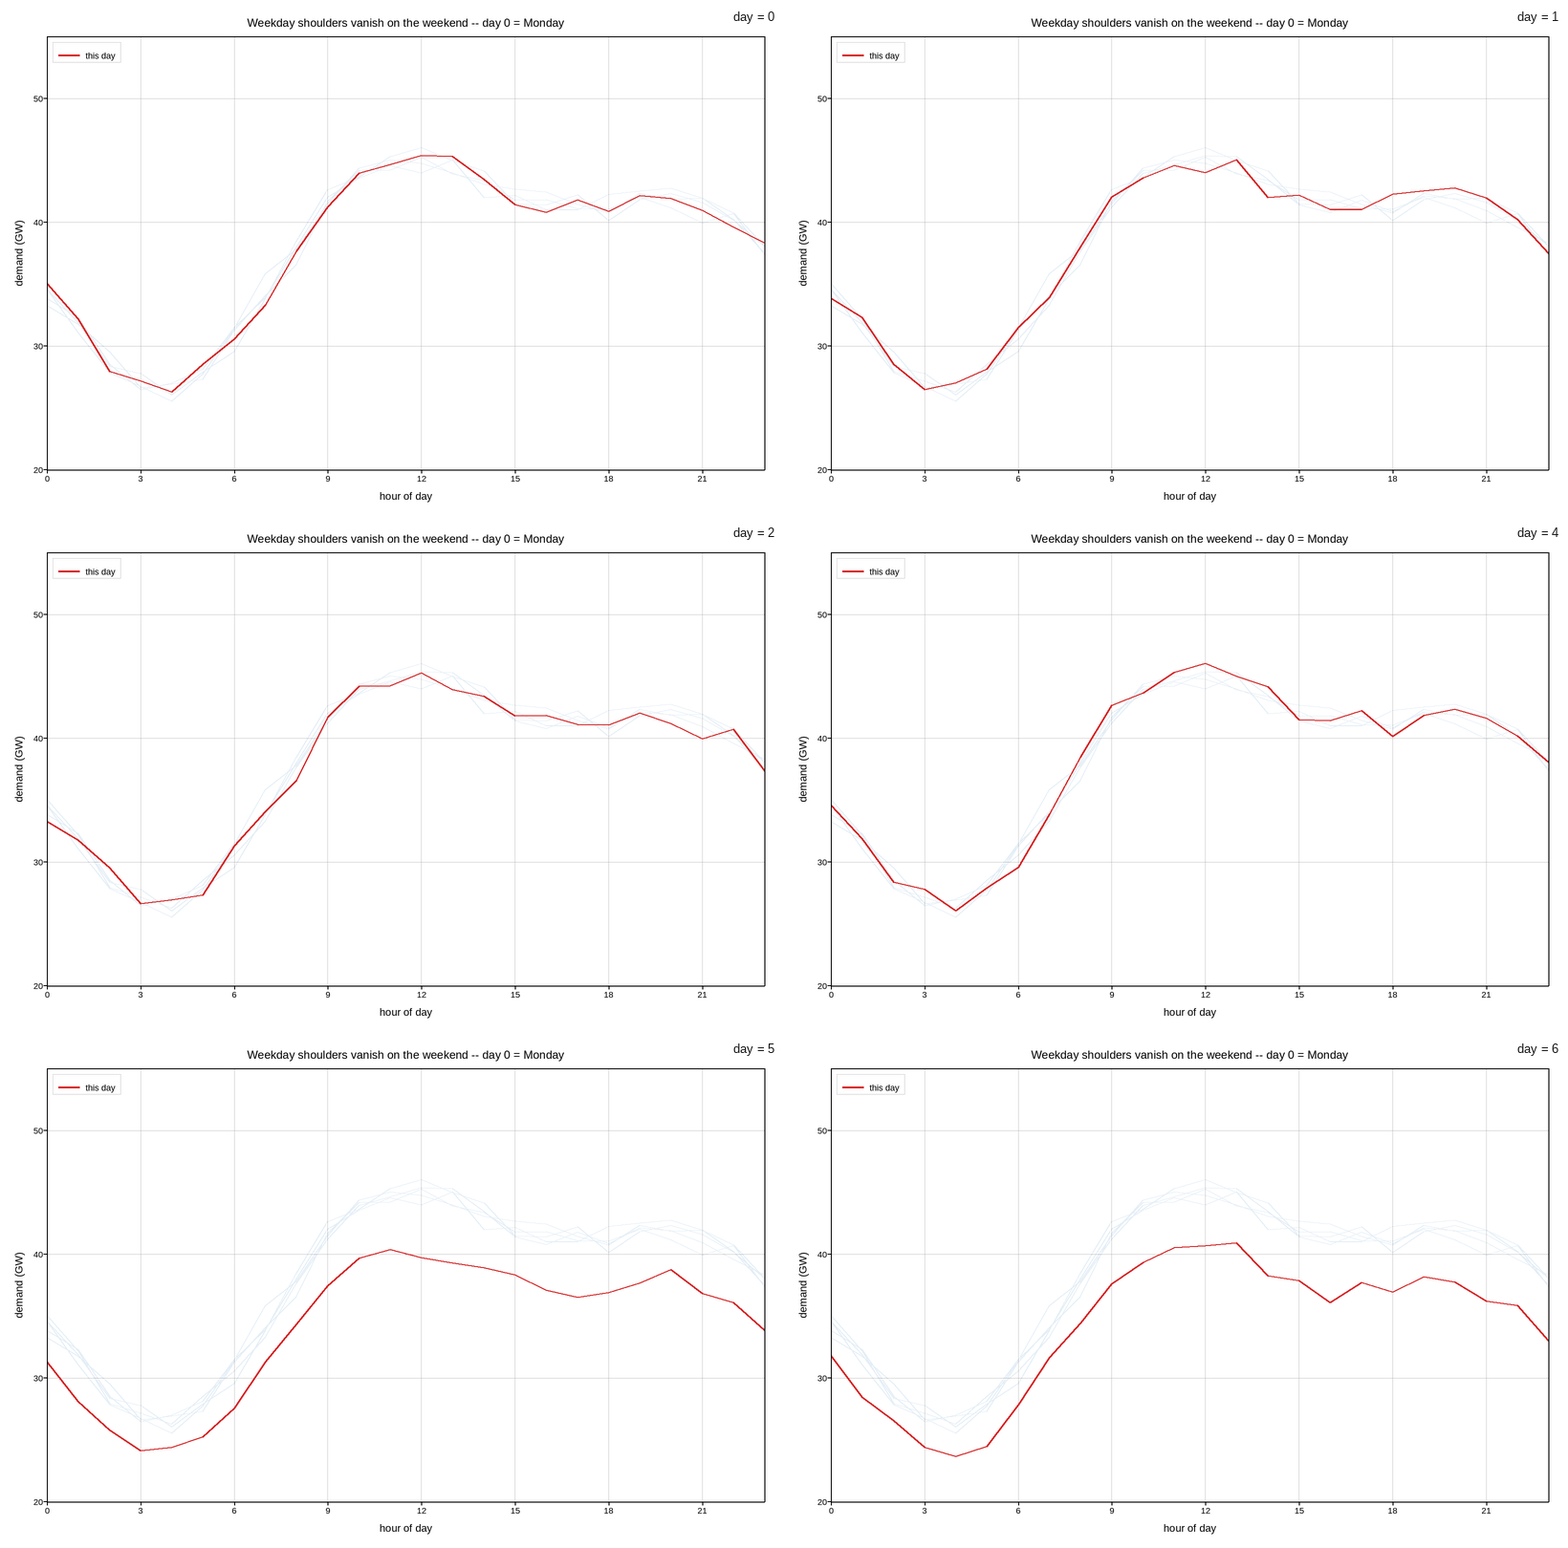
Live figure — pick a tool, then zoom, pan, point-pick or annotate. Nothing is active until a tool is selected.
View this figure’s Vega export ↗ — the raw JSON spec, rendered live by a real Vega engine.
View this figure’s Vega-Lite export ↗ — the raw JSON spec(s), rendered live by a real Vega-Lite engine.
import os
import tempfile

import numpy as np
import plotpress

rng = np.random.default_rng(2023)

hour = np.arange(24)

demand = np.empty((7, 24))
for d in range(7):
    base = 38.0 + 7.5 * np.sin(2 * np.pi * (hour - 9.0) / 24.0) \
        + 4.0 * np.sin(4 * np.pi * (hour - 7.0) / 24.0)
    base *= 1.0 if d < 5 else 0.90                  # weekend demand runs lower
    demand[d] = base + rng.normal(0.0, 0.6, 24)

fig, ax = plotpress.subplots(figsize=(8.2, 5.4))
for d in range(5):                                   # faint weekday context
    ax.plot(hour, demand[d], color="#1f77b4", alpha=0.12, linewidth=1.0)
ax.plot_frames(hour, demand, slider_values=np.arange(7), slider_label="day",
              color="#d62728", label="this day")
ax.set_ylim(20.0, 55.0)
ax.set_xlim(0.0, 23.0)
ax.set_xticks(np.arange(0, 24, 3))
ax.set_xlabel("hour of day")
ax.set_ylabel("demand (GW)")
ax.set_title("Weekday shoulders vanish on the weekend -- day 0 = Monday")
ax.legend(loc="upper left")
ax.grid(True)
fig.tight_layout()

gif_path = os.path.join(tempfile.gettempdir(), "plotpress_weekly_load_curve.gif")
fig.save(gif_path, fps=2)
Total running time of the script: (0 minutes 1.301 seconds)