Note
Go to the end to download the full example code.
A standing wave, actually standing: room modes in time
The same 92 Hz modal pressure field as Room acoustic modal pressure, animated
through one full drive period instead of frozen at a single instant. A
standing wave earns its name here: p(x, y, t) = p(x, y) cos(2 pi f t)
means the spatial pattern set by the room’s geometry never moves, only its
sign and amplitude pulse in time – the antiphase lobes swap between red and
blue together, everywhere at once, while the nodal lines between them sit
exactly still through the whole animation.
That stillness is the physical content, not a rendering artifact. A traveling wave’s pattern would visibly slide across the room; a standing wave’s cannot, because it is built from waves reflecting off rigid walls in both directions at once, and the interference locks every node in place regardless of how long the room rings. Watching the nodal lines stay fixed while everything around them brightens and dims is the single clearest way to see why a room modal problem is a boundary-value problem, not a propagation one.
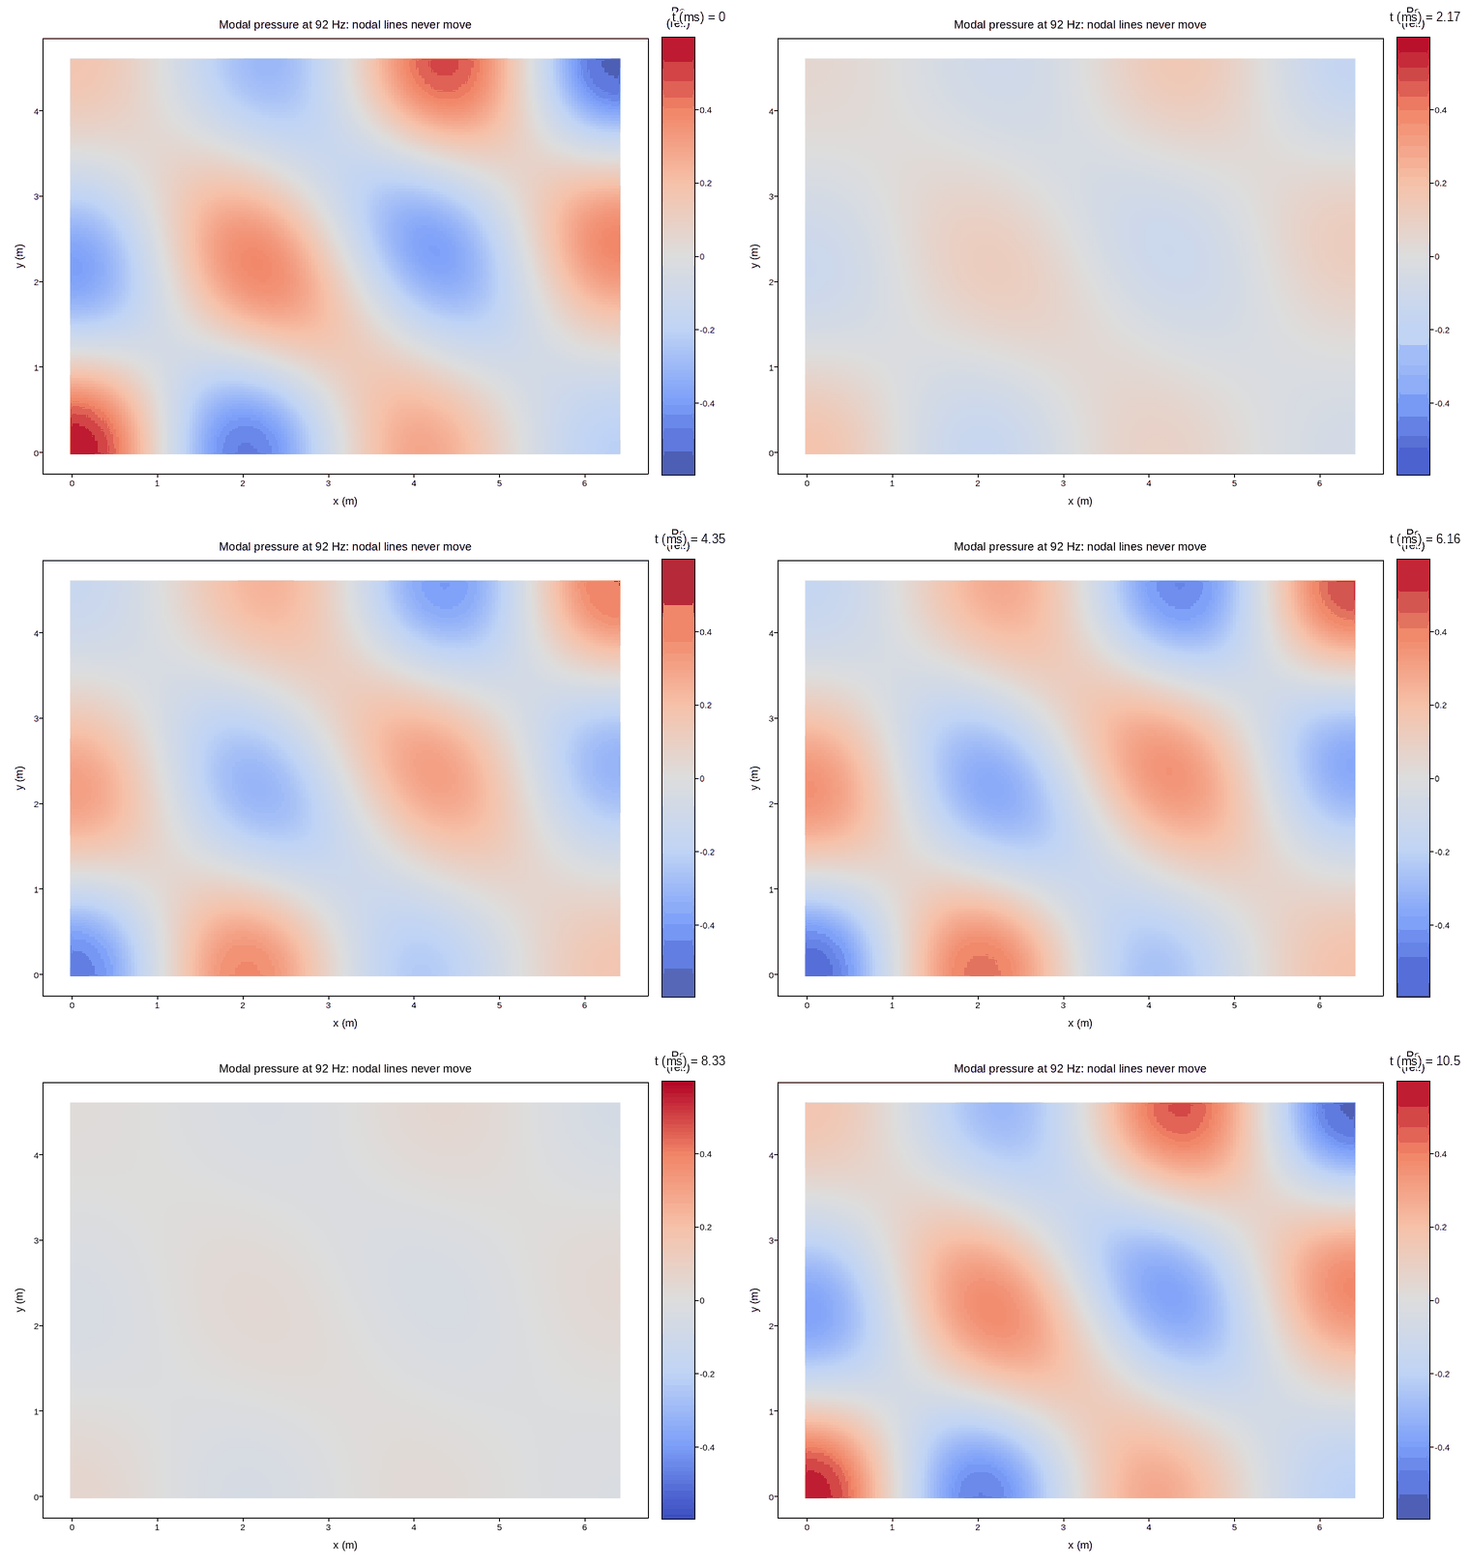
Live figure — pick a tool, then zoom, pan, point-pick or annotate. Nothing is active until a tool is selected.
View this figure’s Vega-Lite export ↗ — the raw JSON spec(s), rendered live by a real Vega-Lite engine.
import os
import tempfile

import numpy as np
import plotpress

LX, LY = 6.4, 4.6                      # room dimensions (m)
C_SOUND = 343.0                        # m/s
F_DRIVE = 92.0                         # Hz

x = np.linspace(0.0, LX, 180)
y = np.linspace(0.0, LY, 140)
X, Y = np.meshgrid(x, y)

MODES = [(3, 2, 1.00), (2, 3, 0.55), (4, 1, 0.35), (1, 1, 0.22)]
spatial = np.zeros_like(X)
for nx, ny, weight in MODES:
    f_mode = 0.5 * C_SOUND * np.hypot(nx / LX, ny / LY)
    phase = 1.0 / (1.0 + ((f_mode - F_DRIVE) / 14.0) ** 2)
    spatial += weight * phase * (np.cos(nx * np.pi * X / LX)
                                 * np.cos(ny * np.pi * Y / LY))
lim = float(np.abs(spatial).max())

N_FRAMES = 30
t = np.linspace(0.0, 1.0 / F_DRIVE, N_FRAMES, endpoint=False)   # one full period
pressure = np.stack([spatial * np.cos(2.0 * np.pi * F_DRIVE * ti) for ti in t])

fig, ax = plotpress.subplots(figsize=(7.6, 5.4))
mesh = ax.pcolormesh_frames(x, y, pressure, slider_values=t * 1e3,
                            slider_label="t (ms)", cmap="coolwarm",
                            vmin=-lim, vmax=lim)
fig.colorbar(mesh, ax=ax).set_title("Pa\n(rel.)")
ax.set_aspect("equal")
ax.set_xlabel("x (m)")
ax.set_ylabel("y (m)")
ax.set_title(f"Modal pressure at {F_DRIVE:.0f} Hz: nodal lines never move")
fig.tight_layout()

gif_path = os.path.join(tempfile.gettempdir(), "plotpress_room_mode_oscillation.gif")
fig.save(gif_path, fps=15)
Total running time of the script: (0 minutes 8.840 seconds)