Note
Go to the end to download the full example code.
Room acoustic modal pressure
The sound pressure field of a rectangular room driven at one of its axial modal frequencies. Below the Schroeder frequency a room does not behave diffusely: it rings at discrete modes, and the standing-wave pattern decides where a listener hears a boom and where a null.
Acoustic pressure is signed – it is a deviation about static atmospheric pressure, and the sign is the phase of the standing wave. Two points half a wavelength apart move in antiphase, which is the whole reason nulls exist. A diverging map with limits symmetric about zero shows that directly: red and blue lobes are the antiphase regions, and the white lines between them are the nodal surfaces where a microphone measures nothing.
Plotting the magnitude instead would merge each antiphase pair and lose the structure the mode is.
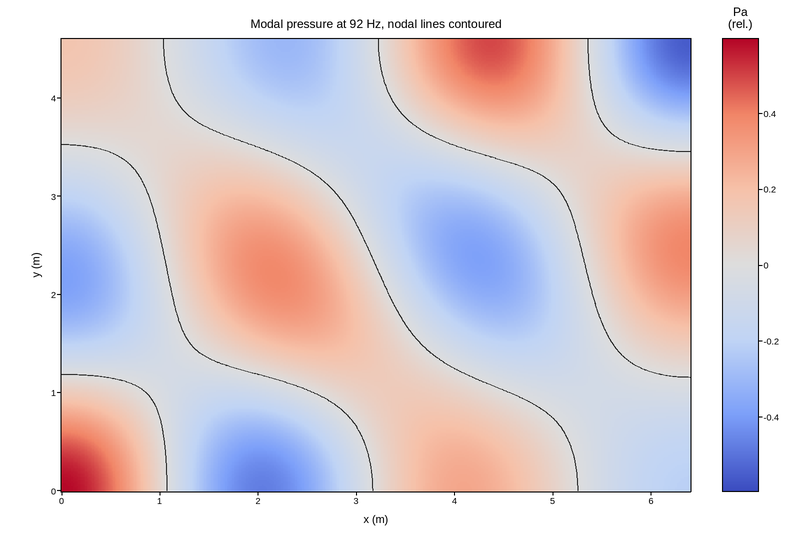
Live figure — pick a tool, then zoom, pan, point-pick or annotate. Nothing is active until a tool is selected.
View this figure’s Vega export ↗ — the raw JSON spec, rendered live by a real Vega engine.
View this figure’s Vega-Lite export ↗ — the raw JSON spec(s), rendered live by a real Vega-Lite engine.
import numpy as np
import polars as pl
import plotpress

LX, LY = 6.4, 4.6                      # room dimensions (m)
C_SOUND = 343.0                        # m/s

x = np.linspace(0.0, LX, 360)
y = np.linspace(0.0, LY, 300)
X, Y = np.meshgrid(x, y)

# Superpose a few low-order modes near the drive frequency, each with the
# rigid-wall cosine shape and its own modal damping.
MODES = [(3, 2, 1.00), (2, 3, 0.55), (4, 1, 0.35), (1, 1, 0.22)]
pressure = np.zeros_like(X)
for nx, ny, weight in MODES:
    f_mode = 0.5 * C_SOUND * np.hypot(nx / LX, ny / LY)
    phase = 1.0 / (1.0 + ((f_mode - 92.0) / 14.0) ** 2)    # driven near 92 Hz
    pressure += weight * phase * (np.cos(nx * np.pi * X / LX)
                                  * np.cos(ny * np.pi * Y / LY))

# One row per sampled (x, y) point -- sorted before the reshape below so the
# pivot back to a grid is correct regardless of row order.
field = pl.DataFrame({
    "x": X.ravel(),
    "y": Y.ravel(),
    "pressure": pressure.ravel(),
}).sort(["y", "x"])

x_axis = field["x"].unique().sort().to_numpy()
y_axis = field["y"].unique().sort().to_numpy()
pressure = field["pressure"].to_numpy().reshape(y_axis.size, x_axis.size)
lim = float(field["pressure"].abs().max())

fig, ax = plotpress.subplots(figsize=(8.0, 5.4))
mesh = ax.pcolormesh(x_axis, y_axis, pressure, cmap="coolwarm", vmin=-lim, vmax=lim)
ax.contour(x_axis, y_axis, pressure, levels=[0.0], colors="#222222")
fig.colorbar(mesh, ax=ax).set_title("Pa\n(rel.)")
ax.set_aspect("equal")
ax.set_xlabel("x (m)")
ax.set_ylabel("y (m)")
ax.set_title("Modal pressure at 92 Hz, nodal lines contoured")
fig.tight_layout()
Total running time of the script: (0 minutes 1.476 seconds)