Note
Go to the end to download the full example code.
Confusion matrix, normalised by true class
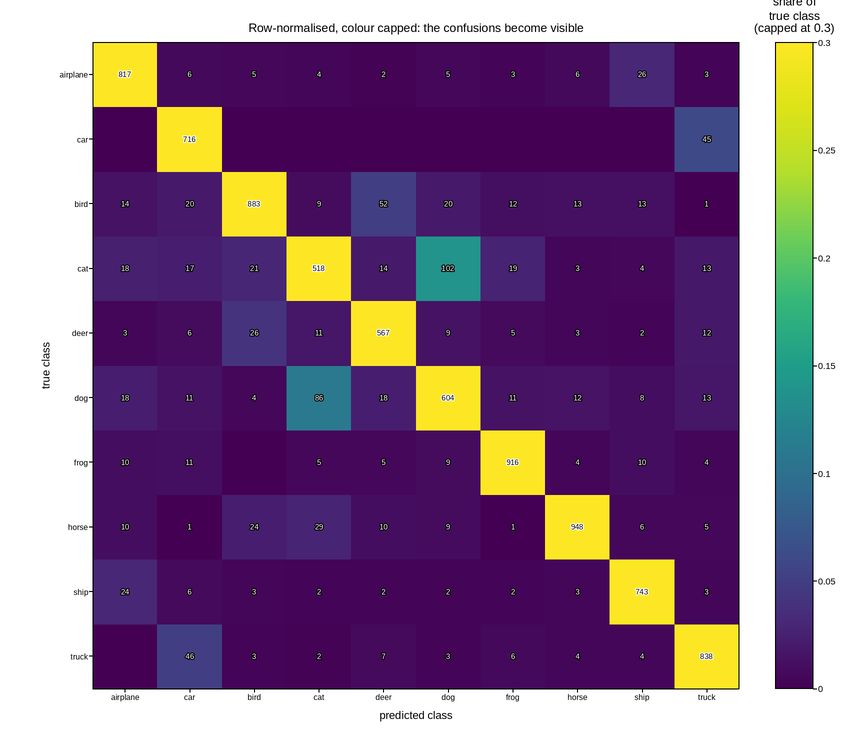
A ten-class classifier’s confusion matrix, drawn as an image with the counts written into the cells. Two decisions make the difference between a figure that diagnoses the model and one that just shows that most predictions are correct.
The matrix is row-normalised: each row is divided by the number of true examples of that class, so the colour reads as “what fraction of this class went where”. Raw counts colour the plot by class frequency instead, and on any imbalanced test set the rare classes – exactly the ones that fail – come out uniformly dark whatever the model does.
The diagonal is then a distraction rather than information: it is always the brightest thing, and it compresses the colour range for everything else. So the colour scale is capped well below 1.0, letting the off-diagonal confusions use the full range. The diagonal saturates, which is fine – its exact value is printed in the cell.
Cell text is drawn in whichever of black or white contrasts with the cell it sits on, chosen from the normalised value rather than fixed, because a single text colour is unreadable at one end of any sequential colormap. Only non-zero cells are annotated, so the eye is not asked to skip eighty zeros to find the six numbers that matter.
Live figure — pick a tool, then zoom, pan, point-pick or annotate. Nothing is active until a tool is selected.
View this figure’s Vega export ↗ — the raw JSON spec, rendered live by a real Vega engine.
View this figure’s Vega-Lite export ↗ — the raw JSON spec(s), rendered live by a real Vega-Lite engine.
import numpy as np
import polars as pl
import plotpress

rng = np.random.default_rng(1024)

CLASSES = ["airplane", "car", "bird", "cat", "deer",
           "dog", "frog", "horse", "ship", "truck"]
n = len(CLASSES)

# Per-class accuracy, and the pairs this model genuinely confuses.
accuracy = np.array([0.93, 0.95, 0.85, 0.71, 0.88, 0.77, 0.94, 0.91, 0.94, 0.92])
CONFUSIONS = {(3, 5): 0.14, (5, 3): 0.11, (2, 4): 0.05, (4, 2): 0.04,
              (1, 9): 0.06, (9, 1): 0.05, (0, 8): 0.03, (8, 0): 0.03}

support = rng.integers(600, 1100, n)               # imbalanced test set
matrix = np.zeros((n, n))
for i in range(n):
    matrix[i, i] = accuracy[i]
for (i, j), share in CONFUSIONS.items():
    matrix[i, j] = share
for i in range(n):
    spill = rng.random(n)
    spill[i] = 0.0
    for j in range(n):
        if matrix[i, j] and j != i:
            spill[j] = 0.0
    # Only *positive* leftover probability is spread around. A class whose
    # accuracy plus named confusions already exceeded one used to get a
    # negative remainder spread back, and the matrix printed cells of -1.
    matrix[i] += max(0.0, 1.0 - matrix[i].sum()) * spill / spill.sum()
matrix /= matrix.sum(axis=1, keepdims=True)        # rows are probabilities

counts = np.round(matrix * support[:, None]).astype(int)
normalised = counts / counts.sum(axis=1, keepdims=True)

# One row per (true class, predicted class) cell -- the shape a classifier's
# own evaluation report is tabulated in, before it is drawn as an image.
TRUE_IDX, PRED_IDX = np.meshgrid(np.arange(n), np.arange(n), indexing="ij")
cells = pl.DataFrame({
    "true_idx": TRUE_IDX.ravel(),
    "pred_idx": PRED_IDX.ravel(),
    "count": counts.ravel(),
    "normalised": normalised.ravel(),
}).sort(["true_idx", "pred_idx"])

normalised = cells["normalised"].to_numpy().reshape(n, n)

# Cap the colour scale below the diagonal: otherwise every off-diagonal cell
# shares the bottom 30% of the ramp and the confusions are indistinguishable.
VMAX = 0.30

fig, ax = plotpress.subplots(figsize=(8.6, 7.4))
im = ax.imshow(normalised, cmap="viridis", vmin=0.0, vmax=VMAX, origin="upper",
               extent=(-0.5, n - 0.5, n - 0.5, -0.5))
bar = fig.colorbar(im, ax=ax)
bar.set_title(f"share of\ntrue class\n(capped at {VMAX:g})")

for row in cells.iter_rows(named=True):
    if row["count"] == 0:
        continue
    shade = min(row["normalised"], VMAX) / VMAX
    ax.text(row["pred_idx"], row["true_idx"], str(row["count"]), ha="center",
            va="center", fontsize=7.5, color="#000000" if shade > 0.55 else "#ffffff")

ax.set_xticks(np.arange(n), CLASSES)
ax.set_yticks(np.arange(n), CLASSES)
ax.tick_params(labelsize=8)
ax.set_aspect("equal")
ax.set_xlabel("predicted class")
ax.set_ylabel("true class")
ax.set_title("Row-normalised, colour capped: the confusions become visible")
fig.tight_layout()
Total running time of the script: (0 minutes 0.269 seconds)