Note
Go to the end to download the full example code.
ROC and precision-recall for an imbalanced problem
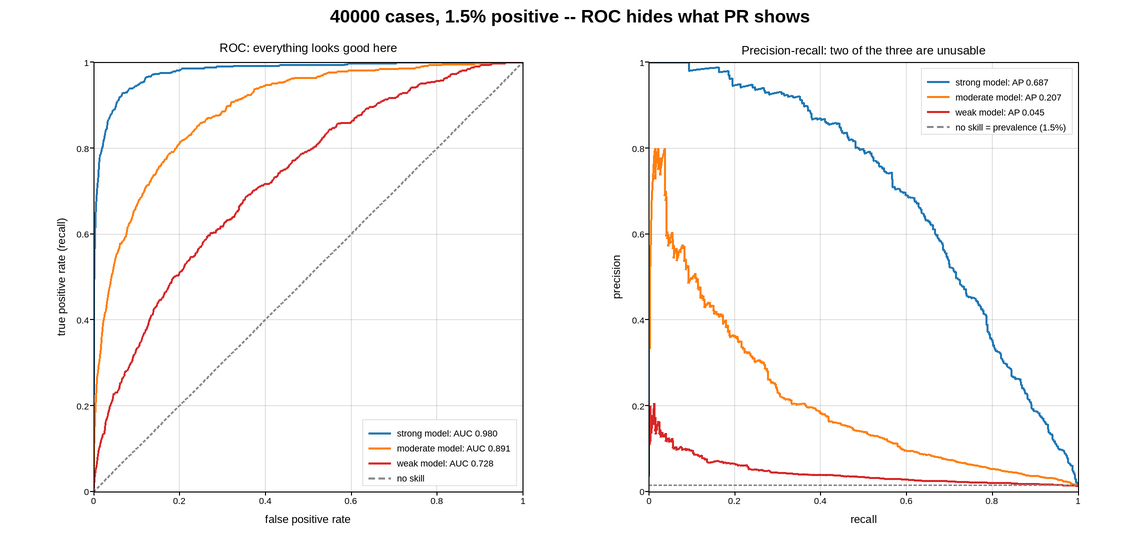
The same three classifiers evaluated two ways, on a problem where 1.5% of cases are positive. The ROC curves on the left all look excellent. The precision-recall curves on the right show that two of the three are unusable. Drawing both is the point: on an imbalanced problem the ROC curve is systematically flattering, and a figure showing only ROC will get a bad model deployed.
The reason is in the denominators. The false-positive rate divides by the number of negatives, which is enormous here, so thousands of false alarms move the ROC curve barely at all. Precision divides by the number of predicted positives, which is small, so the same false alarms halve it.
Both panels get their no-skill baseline drawn, and they are different lines. For ROC it is the diagonal, independent of the data. For precision-recall it is a horizontal line at the positive class prevalence – which is why a precision-recall curve cannot be read without knowing the prevalence, and why it is stated on the panel.
Both axes are pinned to the unit square with equal aspect. These are probabilities against probabilities; letting the axes autoscale to the data would make two models drawn from different runs incomparable at a glance, which is the one thing this figure is for.
Live figure — pick a tool, then zoom, pan, point-pick or annotate. Nothing is active until a tool is selected.
View this figure’s Vega export ↗ — the raw JSON spec, rendered live by a real Vega engine.
View this figure’s Vega-Lite export ↗ — the raw JSON spec(s), rendered live by a real Vega-Lite engine.
import numpy as np
import polars as pl
import plotpress

rng = np.random.default_rng(1971)

N = 40000
PREVALENCE = 0.015

labels = rng.random(N) < PREVALENCE
n_pos = int(labels.sum())

# One row per test case's ground truth -- shared by every model scored
# against it below.
cases = pl.DataFrame({"label": labels})

MODELS = [
    ("strong model", 2.9, "#1f77b4"),
    ("moderate model", 1.7, "#ff7f0e"),
    ("weak model", 0.9, "#d62728"),
]


def curves(separation):
    """Scores from two Gaussians; returns ROC and PR points."""
    score = rng.normal(0.0, 1.0, N) + separation * labels
    # One row per case again, now with this model's score, ranked highest
    # score first -- the order a classifier's own scored output is read in.
    ranked = cases.with_columns(pl.Series("score", score)).sort(
        "score", descending=True)
    hit = ranked["label"].to_numpy()

    tp = np.cumsum(hit)
    fp = np.cumsum(~hit)
    tpr = tp / n_pos
    fpr = fp / (N - n_pos)
    precision = tp / np.maximum(tp + fp, 1)
    auc = float(np.trapezoid(tpr, fpr))
    ap = float(np.sum(np.diff(np.concatenate([[0.0], tpr])) * precision))
    return fpr, tpr, tpr, precision, auc, ap


fig, axes = plotpress.subplots(1, 2, figsize=(11.4, 5.4))
ax_roc, ax_pr = axes

for name, separation, color in MODELS:
    fpr, tpr, recall, precision, auc, ap = curves(separation)
    ax_roc.plot(fpr, tpr, color=color, linewidth=1.9, label=f"{name}: AUC {auc:.3f}")
    ax_pr.plot(recall, precision, color=color, linewidth=1.9,
               label=f"{name}: AP {ap:.3f}")

ax_roc.plot([0, 1], [0, 1], color="#888888", linestyle="--", linewidth=1.3,
            label="no skill")
ax_roc.set_xlim(0.0, 1.0)
ax_roc.set_ylim(0.0, 1.0)
ax_roc.set_aspect("equal")
ax_roc.set_xlabel("false positive rate")
ax_roc.set_ylabel("true positive rate (recall)")
ax_roc.set_title("ROC: everything looks good here")
ax_roc.legend(loc="lower right")
ax_roc.grid(True)

ax_pr.axhline(PREVALENCE, color="#888888", linestyle="--", linewidth=1.3,
              label=f"no skill = prevalence ({PREVALENCE:.1%})")
ax_pr.set_xlim(0.0, 1.0)
ax_pr.set_ylim(0.0, 1.0)
ax_pr.set_aspect("equal")
ax_pr.set_xlabel("recall")
ax_pr.set_ylabel("precision")
ax_pr.set_title("Precision-recall: two of the three are unusable")
ax_pr.legend(loc="upper right")
ax_pr.grid(True)

fig.suptitle(f"{N} cases, {PREVALENCE:.1%} positive -- ROC hides what PR shows")
fig.tight_layout()
Total running time of the script: (0 minutes 1.979 seconds)