Note
Go to the end to download the full example code.
A control chart, revealed subgroup by subgroup
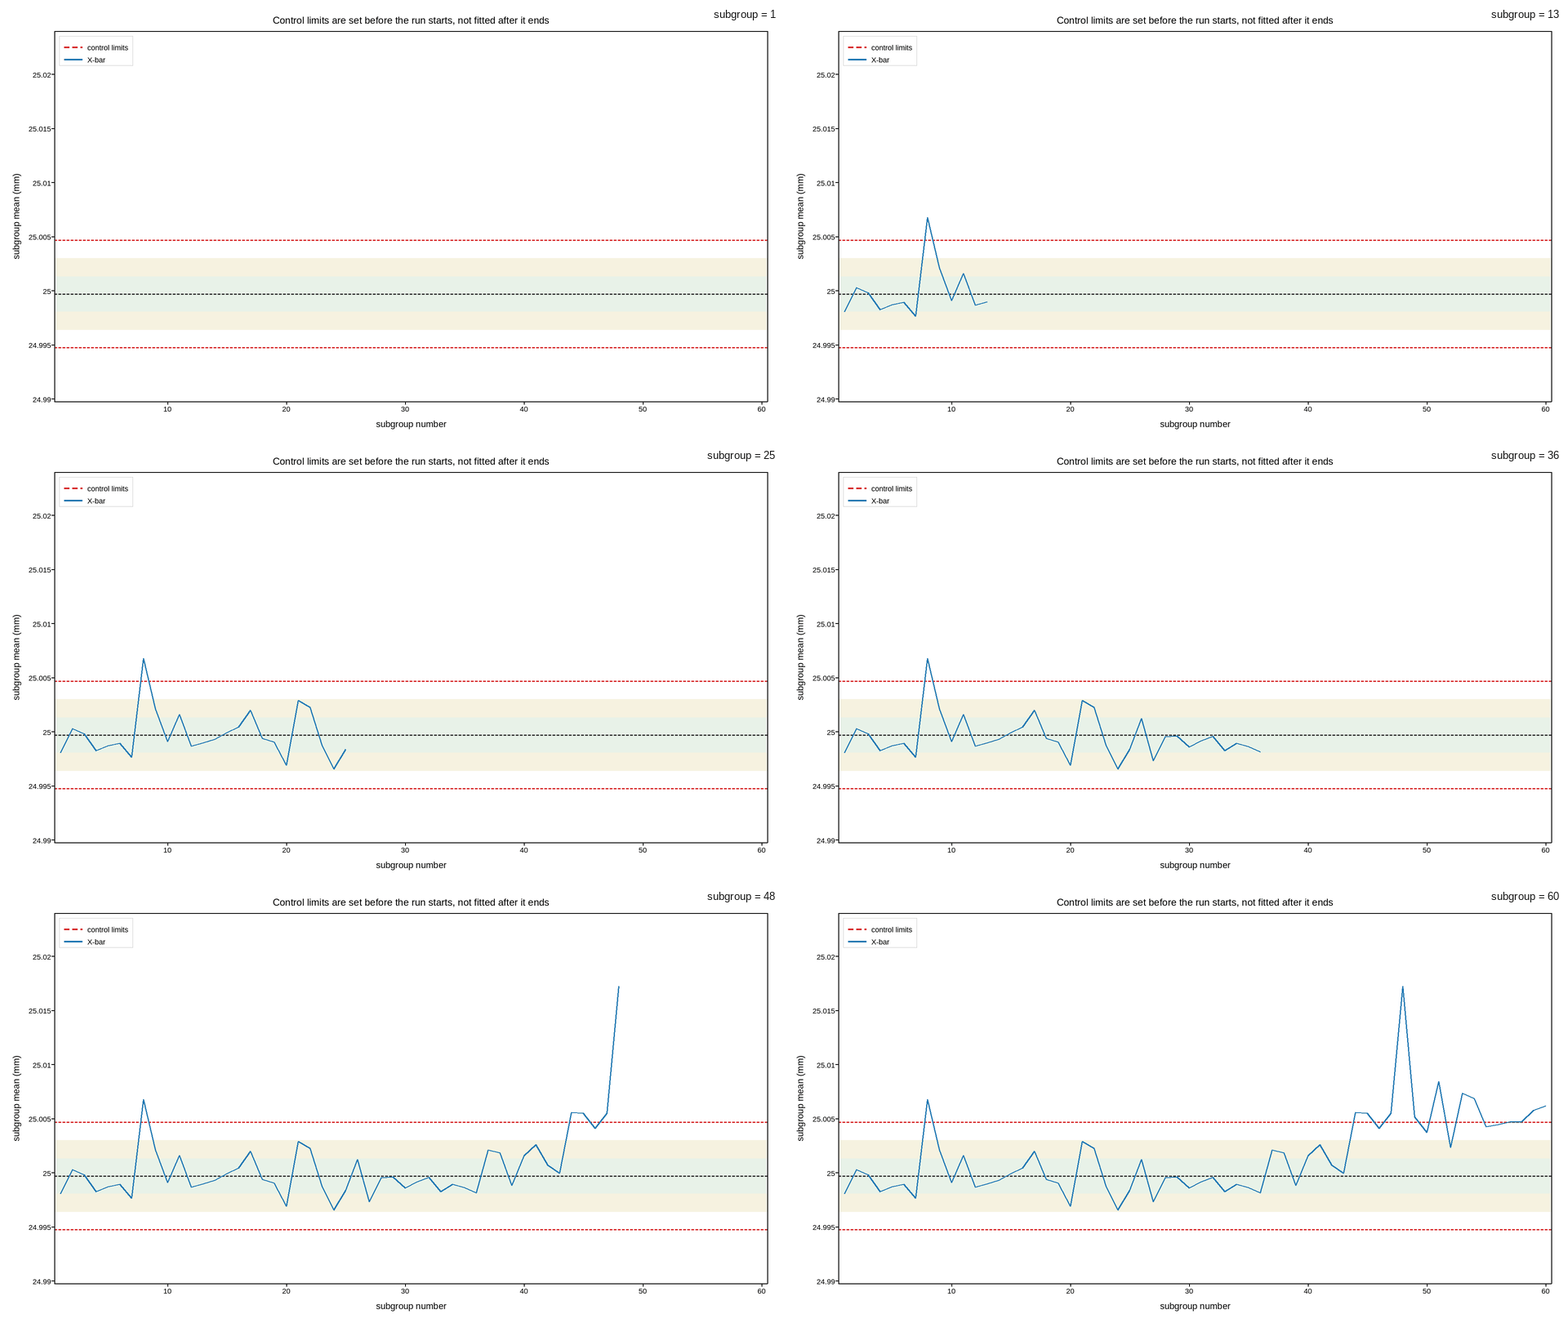
The same X-bar data as X-bar and R control chart, watched the way a
quality technician actually sees it: one subgroup at a time, as production
runs, rather than as sixty points already sitting on a finished chart. Each
frame reveals one more subgroup – the unrevealed ones held at nan, the
same technique A training run, revealed epoch by epoch uses for a
training run – while the control limits themselves stay fixed throughout,
because they were set from the first thirty subgroups before this run
started, not fitted to whatever the chart happens to show by the end.
Watching the reveal is the point a static chart cannot make. The tool-wear drift starting around subgroup 34 does not visibly leave the control limits until several subgroups later, and only in hindsight – with the whole chart in view – does the run of points above the centre line jump out. A technician watching live has to catch the same run rule the chart is annotated with here, in real time, without the benefit of seeing the future points that make it obvious.
Live figure — pick a tool, then zoom, pan, point-pick or annotate. Nothing is active until a tool is selected.
View this figure’s Vega export ↗ — the raw JSON spec, rendered live by a real Vega engine.
View this figure’s Vega-Lite export ↗ — the raw JSON spec(s), rendered live by a real Vega-Lite engine.
import os
import tempfile

import numpy as np
import polars as pl
import plotpress

rng = np.random.default_rng(1924)

SUBGROUP = 5
N_GROUPS = 60
TARGET = 25.000
SIGMA = 0.0042
A2, D3, D4, D2 = 0.577, 0.0, 2.114, 2.326

groups = np.arange(1, N_GROUPS + 1)

parts = rng.normal(TARGET, SIGMA, (N_GROUPS, SUBGROUP))
drift = np.clip(np.arange(N_GROUPS) - 34, 0.0, None) * 0.00028
parts += drift[:, None]
parts[47] += 0.0135

measurements = pl.DataFrame({"group": np.repeat(groups, SUBGROUP), "value": parts.ravel()})
subgroups = measurements.group_by("group", maintain_order=True).agg(
    pl.col("value").mean().alias("xbar"),
    (pl.col("value").max() - pl.col("value").min()).alias("range"),
)
xbar = subgroups["xbar"].to_numpy()
rng_bar = subgroups["range"].to_numpy()

BASE = slice(0, 30)
centre_x = xbar[BASE].mean()
centre_r = rng_bar[BASE].mean()
ucl_x, lcl_x = centre_x + A2 * centre_r, centre_x - A2 * centre_r
sigma_hat = centre_r / (D2 * np.sqrt(SUBGROUP))

# Frame f reveals subgroups 0..f; the rest are nan, matching how these
# points actually arrive -- one at a time, not all at once.
revealed = np.full((N_GROUPS, N_GROUPS), np.nan)
for f in range(N_GROUPS):
    revealed[f, :f + 1] = xbar[:f + 1]

fig, ax = plotpress.subplots(figsize=(9.6, 5.4))
for k, shade in [(1, "#e8f2e8"), (2, "#f6f2e0")]:
    ax.axhspan(centre_x + (k - 1) * sigma_hat, centre_x + k * sigma_hat,
              color=shade, alpha=1.0)
    ax.axhspan(centre_x - k * sigma_hat, centre_x - (k - 1) * sigma_hat,
              color=shade, alpha=1.0)
ax.axhline(centre_x, color="#333333", linewidth=1.3)
ax.axhline(ucl_x, color="#d62728", linewidth=1.3, linestyle="--", label="control limits")
ax.axhline(lcl_x, color="#d62728", linewidth=1.3, linestyle="--")
ax.plot_frames(groups, revealed, slider_values=groups, slider_label="subgroup",
              color="#1f77b4", label="X-bar")
ax.set_xlim(0.5, N_GROUPS + 0.5)
ax.set_ylim(lcl_x - 3 * sigma_hat, TARGET + 0.024)
ax.set_xlabel("subgroup number")
ax.set_ylabel("subgroup mean (mm)")
ax.set_title("Control limits are set before the run starts, not fitted after it ends")
ax.legend(loc="upper left")
fig.tight_layout()

gif_path = os.path.join(tempfile.gettempdir(), "plotpress_control_chart_live.gif")
fig.save(gif_path, fps=10)
Total running time of the script: (0 minutes 12.425 seconds)