Note
Go to the end to download the full example code.
Multichannel EEG montage
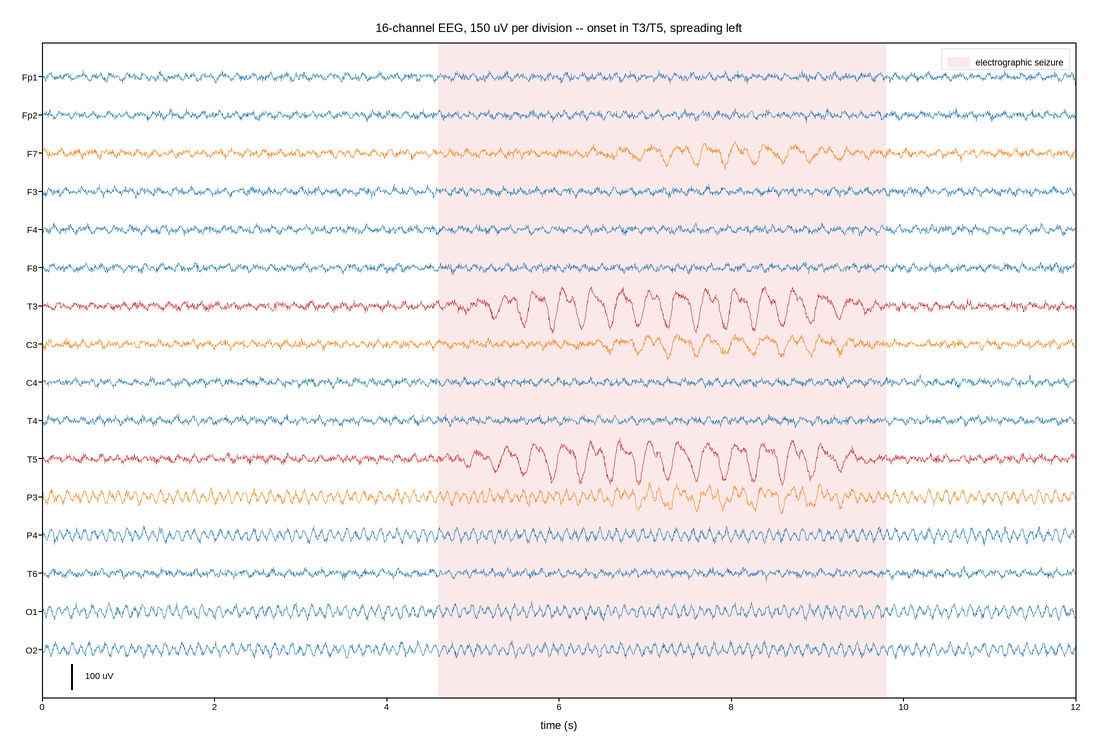
Sixteen electrodes of scalp EEG, twelve seconds each. Read this the way a neurophysiologist does: not as sixteen plots but as one picture whose subject is which channels do the same thing at the same time.
That dictates the layout. All channels share one axes with a fixed vertical
offset per trace, rather than sixteen stacked subplots – stacking would put a
frame, a gap and a pair of axis labels between neighbours and destroy exactly
the spatial comparison the montage exists for. The y ticks become channel names
via set_yticks(positions, labels), so the axis is a legend, and a calibration
bar carries the amplitude scale that the y axis no longer can.
The offset is chosen against the data: large enough that traces rarely collide, small enough that the montage stays compact. There is no correct answer, so the figure states the value used instead of leaving the reader to guess.
The event drawn here is a focal seizure – rhythmic 3 Hz activity that begins in
two temporal channels and spreads. Shading the electrographic seizure with
axvspan puts the interpretation on the figure without covering the trace,
and the low alpha keeps the signal readable through it.
Live figure — pick a tool, then zoom, pan, point-pick or annotate. Nothing is active until a tool is selected.
View this figure’s Vega export ↗ — the raw JSON spec, rendered live by a real Vega engine.
View this figure’s Vega-Lite export ↗ — the raw JSON spec(s), rendered live by a real Vega-Lite engine.
import numpy as np
import polars as pl
import plotpress

rng = np.random.default_rng(88)

FS = 200.0
DURATION = 12.0
t = np.arange(0.0, DURATION, 1.0 / FS)

channels = ["Fp1", "Fp2", "F7", "F3", "F4", "F8", "T3", "C3",
            "C4", "T4", "T5", "P3", "P4", "T6", "O1", "O2"]
FOCUS = {"T3", "T5"}                              # seizure onset zone
SPREAD = {"F7", "C3", "P3"}                       # recruited a second later
SEIZURE = (4.6, 9.8)

traces = []
for name in channels:
    # Background rhythms: posterior alpha is strongest occipitally.
    alpha_gain = 1.6 if name in ("O1", "O2", "P3", "P4") else 0.5
    x = alpha_gain * 11.0 * np.sin(2 * np.pi * 10.2 * t + rng.uniform(0, 6.3))
    x += 7.0 * np.sin(2 * np.pi * 5.5 * t + rng.uniform(0, 6.3))
    x += rng.normal(0.0, 6.0, t.size)             # broadband EEG noise, in uV

    if name in FOCUS or name in SPREAD:
        onset = SEIZURE[0] + (0.0 if name in FOCUS else 1.4)
        env = np.clip((t - onset) / 1.2, 0.0, 1.0) * (t < SEIZURE[1])
        env = env * np.clip((SEIZURE[1] - t) / 1.0, 0.0, 1.0)
        amp = 62.0 if name in FOCUS else 30.0
        # Sharp-and-slow morphology: a 3 Hz fundamental plus its harmonic.
        x += env * amp * (np.sin(2 * np.pi * 3.0 * t)
                          + 0.45 * np.sin(2 * np.pi * 6.0 * t + 0.9))
    traces.append(x)

# One row per channel sample -- the shape an EEG amplifier's own multichannel
# export is in, before each channel is offset and plotted on the montage.
recording = pl.concat([
    pl.DataFrame({"channel": name, "time": t, "microvolts": x})
    for name, x in zip(channels, traces)
])

OFFSET = 150.0                                     # microvolts between channels
positions = -OFFSET * np.arange(len(channels), dtype=float)

fig, ax = plotpress.subplots(figsize=(11.0, 7.5))
ax.axvspan(SEIZURE[0], SEIZURE[1], color="#d62728", alpha=0.10,
           label="electrographic seizure")
for name, y0 in zip(channels, positions):
    channel = recording.filter(pl.col("channel") == name)
    color = "#d62728" if name in FOCUS else ("#ff7f0e" if name in SPREAD
                                             else "#1f77b4")
    ax.plot(channel["time"].to_numpy(), channel["microvolts"].to_numpy() + y0,
            color=color, linewidth=0.7)

# Calibration bar: the amplitude scale the shared y axis cannot show. It sits
# below the last trace rather than beside it, where nothing can overlap it.
bar_x, bar_y = 0.35, positions[-1] - 1.05 * OFFSET
ax.plot([bar_x, bar_x], [bar_y, bar_y + 100.0], color="#000000", linewidth=1.8)
ax.text(bar_x + 0.15, bar_y + 42.0, "100 uV", ha="left", va="baseline",
        fontsize=9)

ax.set_yticks(positions, channels)
ax.set_ylim(positions[-1] - 1.25 * OFFSET, positions[0] + 0.9 * OFFSET)
ax.set_xlim(0.0, 12.0)
ax.set_xlabel("time (s)")
ax.set_title(f"16-channel EEG, {OFFSET:.0f} uV per division -- "
             "onset in T3/T5, spreading left")
ax.legend(loc="upper right")
fig.tight_layout()
Total running time of the script: (0 minutes 0.907 seconds)