Note
Go to the end to download the full example code.
Reload a mesh grid and FFT every panel
A second reload scenario, this time transforming rather than slicing:
Reload a mesh grid and replot one slice per panel as a line pulls one row out of each panel’s
mesh, but the full 2-D grid load_data() hands back supports any NumPy
operation – here, a 2-D FFT run over every panel at once, replotted as a
new mesh in the same grid template.
As in that example, the source figure is built and saved here only to have
a self-contained file to load back from – load_data() doesn’t care
whether the file it’s reading was written a moment ago or came from an
entirely separate run. The destination grid is rebuilt from
load_data()’s own "template" entry via
plotpress.figure_from_template(), rather than the caller having to
already know it was a 5x6 grid – or re-type each panel’s own title.
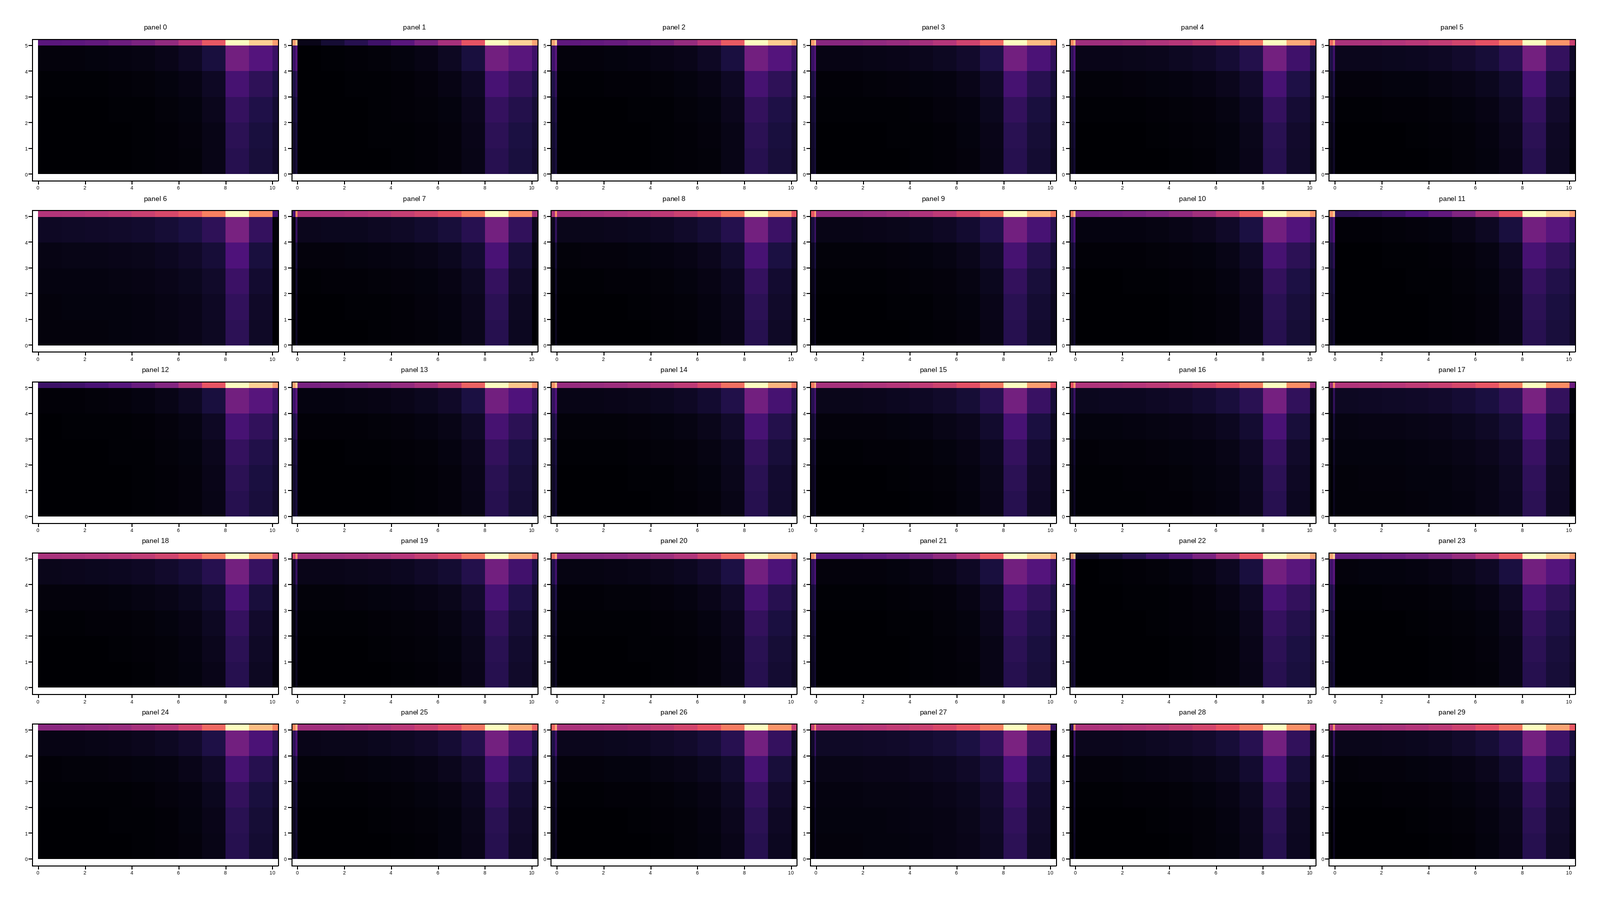
This figure has 30 panels — too many to usefully embed at a fixed size.
Open the full interactive example in a new page to pick a tool, then zoom, pan, point-pick or annotate any panel.
View this figure’s Vega export ↗ — the raw JSON spec, rendered live by a real Vega engine.
View this figure’s Vega-Lite export ↗ — the raw JSON spec(s), rendered live by a real Vega-Lite engine.
import os
import tempfile

import numpy as np
import plotpress


def _build_source_html():
    """The same 30-panel pcolormesh grid as plot_01, saved as interactive
    HTML -- standing in for a figure produced by an earlier, separate run."""
    fig, axes = plotpress.subplots(5, 6, figsize=(16, 9))
    x = np.linspace(0, 10, 21)
    y = np.linspace(0, 5, 11)
    X, Y = np.meshgrid(x, y)
    for i, ax in enumerate(np.asarray(axes).ravel()):
        Z = np.sin(X - 0.3 * i) * np.exp(-0.05 * Y)
        ax.pcolormesh(x, y, Z, cmap="viridis", vmin=-1, vmax=1)
        ax.set_title(f"panel {i}", fontsize=7)
        ax.tick_params(labelsize=5)
    fig.tight_layout()
    path = os.path.join(tempfile.gettempdir(), "plotpress_gallery_mesh_grid_fft.html")
    fig.save(path, interactive=True)
    return path


source_path = _build_source_html()
data = plotpress.load_data(source_path)
# A bare (non-Report) figure has no report-level title of its own, so it
# falls back to the same "Figure N" label a Report page would show it under.
fig_entry = data["Figure 1"]
axes_data = fig_entry["axes"]    # keyed by each panel's own title

# ---------------------------------------------------------------------------
# 2-D FFT every panel's mesh, replotting the (log-scaled, zero-frequency
# centered) magnitude spectrum as a new mesh in a rebuilt copy of the same
# 5x6 template -- figure_from_template() reads the grid shape back out of
# fig_entry["template"] instead of it being hand-typed here.
# ---------------------------------------------------------------------------
fig, axes = plotpress.figure_from_template(fig_entry["template"])
for i, ax in enumerate(np.asarray(axes).ravel()):
    mesh = axes_data[f"panel {i}"]["meshes"][0]
    spectrum = np.abs(np.fft.fftshift(np.fft.fft2(mesh["z"])))
    ax.pcolormesh(np.log1p(spectrum), cmap="magma")
    ax.tick_params(labelsize=5)
fig.tight_layout()
Total running time of the script: (0 minutes 0.859 seconds)