Note
Go to the end to download the full example code.
Hidden per-panel labels survive the round trip (and the Extract)
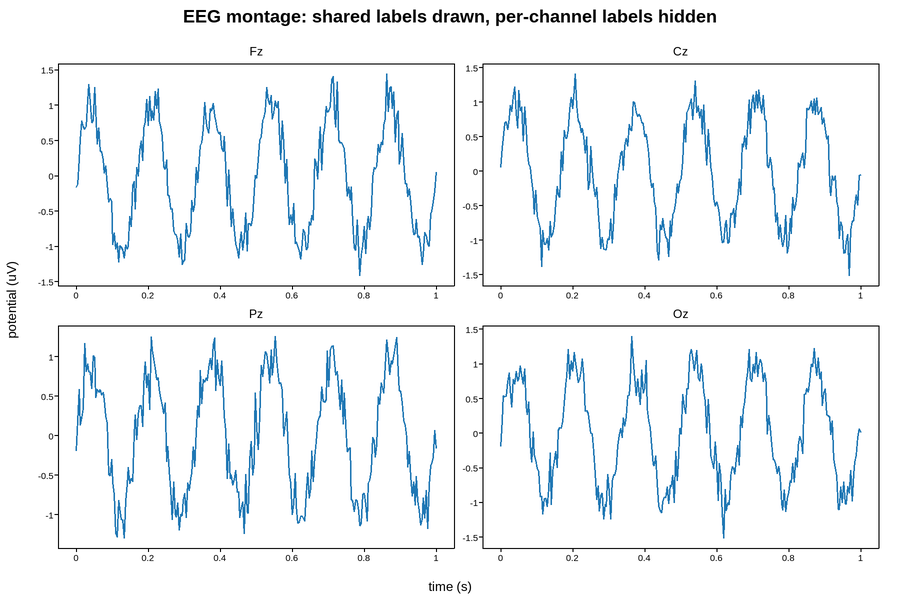
A grid that names every panel’s axes for later data extraction, but
draws only one shared supxlabel()/
supylabel() pair, using
set_xlabel(..., visible=False) (see
Hidden axis labels (stored, not drawn)).
The hidden labels aren’t just cosmetic-free – they’re recorded.
load_data()’s "template" carries each one (plus a visible: false
flag), plotpress.figure_from_template() rebuilds every panel with
its label still attached and still hidden, and in the interactive HTML a
Point Picking Extract pulls each picked value out with its panel’s
xlabel/ylabel and the figure’s supxlabel/supylabel/
suptitle alongside – so a value lifted out of a CSV still says what
it means (see Interactive figures for the full record
shape). The last block below prints exactly that record, built from the
saved template.
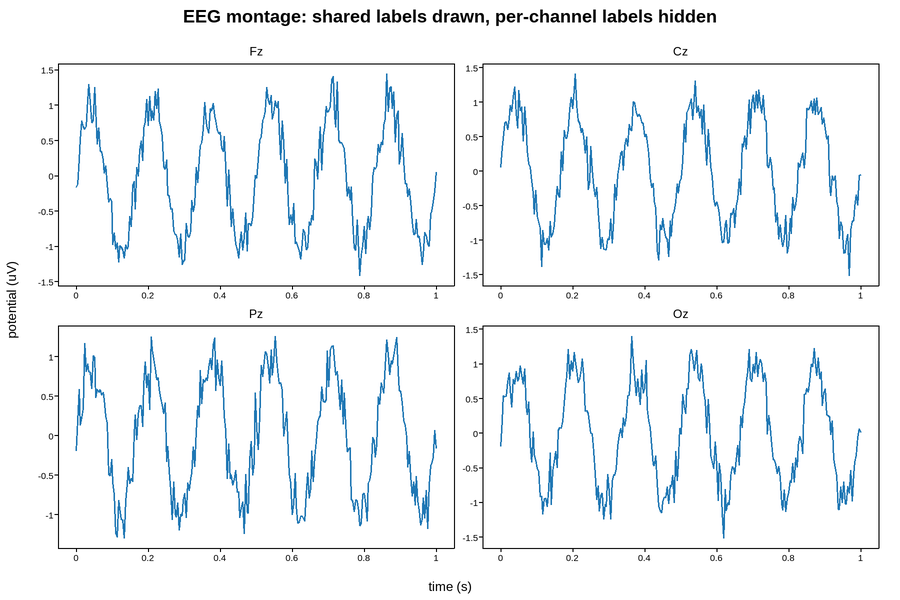
This renders the source figure and the one rebuilt from its own saved HTML – every panel’s label recovered, still hidden, drawn nowhere.
Live figure — pick a tool, then zoom, pan, point-pick or annotate. Nothing is active until a tool is selected.
View this figure’s Vega export ↗ — the raw JSON spec, rendered live by a real Vega engine.
View this figure’s Vega-Lite export ↗ — the raw JSON spec(s), rendered live by a real Vega-Lite engine.
Live figure — pick a tool, then zoom, pan, point-pick or annotate. Nothing is active until a tool is selected.
View this figure’s Vega export ↗ — the raw JSON spec, rendered live by a real Vega engine.
View this figure’s Vega-Lite export ↗ — the raw JSON spec(s), rendered live by a real Vega-Lite engine.
rebuilt panel label: 'time (s)' visible: False
template recorded visibility: False
  axes        0
  axes_title  'Fz'
  kind        'points'
  index       42
  x           0.164
  y           0.71
  xlabel      'time (s)'
  ylabel      'potential (uV)'
  supxlabel   'time (s)'
  supylabel   'potential (uV)'
  suptitle    'EEG montage: shared labels drawn, per-channel labels hidden'
import os
import tempfile

import numpy as np
import plotpress

CHANNELS = ["Fz", "Cz", "Pz", "Oz"]

fig, axes = plotpress.subplots(2, 2, figsize=(9, 6))
rng = np.random.default_rng(5)
t = np.linspace(0, 1, 256)
for ax, name in zip(axes.ravel(), CHANNELS):
    ax.plot(t, np.sin(2 * np.pi * 6 * t) + 0.2 * rng.standard_normal(t.size))
    ax.set_title(name)
    # Named for export, hidden on the canvas.
    ax.set_xlabel("time (s)", visible=False)
    ax.set_ylabel("potential (uV)", visible=False)

fig.supxlabel("time (s)")
fig.supylabel("potential (uV)")
fig.suptitle("EEG montage: shared labels drawn, per-channel labels hidden")
fig.tight_layout()

path = os.path.join(tempfile.gettempdir(), "plotpress_hidden_labels_roundtrip.html")
fig.save(path, interactive=True)

# ---------------------------------------------------------------------------
# Load it back. figure_from_template() has already re-attached every hidden
# label by the time this loop starts -- nothing below re-types one.
# ---------------------------------------------------------------------------
entry = plotpress.load_data(path)["Figure 1"]
template, axes_data = entry["template"], entry["axes"]

rebuilt_fig, rebuilt_axes = plotpress.figure_from_template(template)
for ax, name in zip(np.asarray(rebuilt_axes).ravel(), CHANNELS):
    s = axes_data[name]["series"][0]
    ax.plot(s["x"], s["y"])
rebuilt_fig.tight_layout()

# Every rebuilt panel carries its hidden label back -- stored, flagged
# hidden, and (as the SVG check confirms) still drawn nowhere.
one = rebuilt_fig.get_ax(row=1, col=0)
print("rebuilt panel label:", repr(one.get_xlabel()),
      "visible:", one.get_xlabel_visible())
print("template recorded visibility:", template["axes"][2].get("xlabel_visible"))

for name in CHANNELS:
    ax = rebuilt_fig.get_ax(title=name)
    assert ax.get_xlabel() == "time (s)" and not ax.get_xlabel_visible()
    assert ax.get_ylabel() == "potential (uV)" and not ax.get_ylabel_visible()
svg = rebuilt_fig.to_svg()
assert "potential (uV)" in svg          # once, as the shared supylabel
assert svg.count("time (s)") == 1       # once, as the shared supxlabel

# ---------------------------------------------------------------------------
# The same context the interactive HTML's Point Picking **Extract** attaches
# to every picked record -- assembled here from the saved template to show
# exactly which fields ride along. In the browser you'd click a point in the
# top-left panel and hit Extract; the CSV row / JSON dict carries:
# ---------------------------------------------------------------------------
top_left = template["axes"][0]
example_record = {
    "axes": 0,
    "axes_title": top_left["title"],          # "Fz"
    "kind": "points", "index": 42,
    "x": 0.164, "y": 0.71,                    # the picked data value
    "xlabel": top_left["xlabel"],             # "time (s)" -- hidden on the plot
    "ylabel": top_left["ylabel"],             # "potential (uV)" -- also hidden
    "supxlabel": template["supxlabel"]["text"],
    "supylabel": template["supylabel"]["text"],
    "suptitle": template["suptitle"]["text"],
}
for k, v in example_record.items():
    print(f"  {k:11} {v!r}")
Total running time of the script: (0 minutes 0.323 seconds)