Note
Go to the end to download the full example code.
Reload a mesh grid and replot one slice per panel as a line
plotpress.load_data() reads the plotted data straight back out of a
saved interactive HTML file – the original Python objects that built it
don’t need to still be around. That matters whenever the figure and the
code behind it have drifted apart: a report generated earlier, handed off
by someone else, or produced by a pipeline that never kept the arrays
after writing the file.
The source figure below – a 30-panel grid of independent sensor sweeps,
each its own pcolormesh – is built and saved here only to have a
self-contained interactive file to load back from; in practice this file
could equally well already exist from an earlier run, with none of this
module in scope. load_data() keys each panel by its own title by
default – so "panel 5" reads back as "panel 5", not a bare index
that has to line up with however the grid was built – and returns each
panel’s mesh as a 2-D z array plus its own 1-D x/y cell-center
coordinates, so slicing a fixed row out of z and pairing it with x
is exactly the (x, y) pair ax.plot() expects – no re-deriving the
grid from the mesh’s edges or extent by hand.
The destination figure also no longer needs to hand-know it was a 5x6
grid, or re-type each panel’s own title: load_data()’s "template"
entry carries the source figure’s grid shape, every axes’ own title/label/
limit/scale (and any plotpress.Figure.group() boxes), and
plotpress.figure_from_template() rebuilds an equivalent,
already-labeled figure from it – ready to replot the recovered data into,
with nothing decorative left to re-apply by hand.
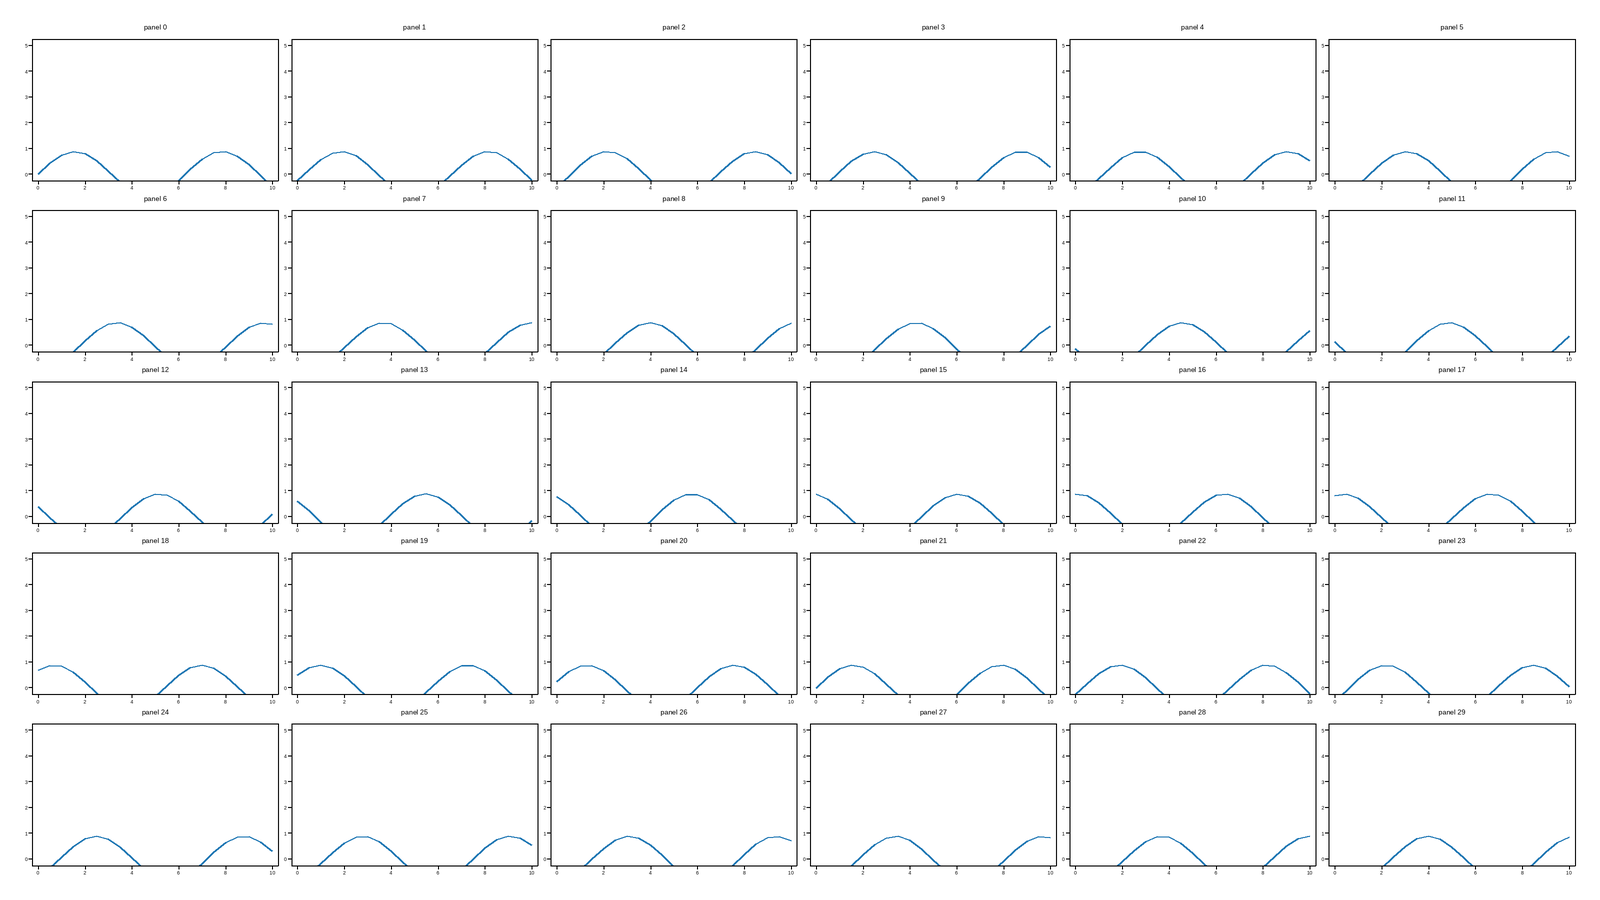
This figure has 30 panels — too many to usefully embed at a fixed size.
Open the full interactive example in a new page to pick a tool, then zoom, pan, point-pick or annotate any panel.
View this figure’s Vega export ↗ — the raw JSON spec, rendered live by a real Vega engine.
View this figure’s Vega-Lite export ↗ — the raw JSON spec(s), rendered live by a real Vega-Lite engine.
import os
import tempfile

import numpy as np
import plotpress


def _build_source_html():
    """A 30-panel pcolormesh grid, saved as interactive HTML -- standing in
    for a figure produced (and saved) by an earlier, separate run."""
    fig, axes = plotpress.subplots(5, 6, figsize=(16, 9))
    x = np.linspace(0, 10, 21)
    y = np.linspace(0, 5, 11)
    X, Y = np.meshgrid(x, y)
    for i, ax in enumerate(np.asarray(axes).ravel()):
        # A travelling-wave-like field, phase-offset per panel so each
        # panel's x-slice below comes out meaningfully different.
        Z = np.sin(X - 0.3 * i) * np.exp(-0.05 * Y)
        ax.pcolormesh(x, y, Z, cmap="viridis", vmin=-1, vmax=1)
        ax.set_title(f"panel {i}", fontsize=7)
        ax.tick_params(labelsize=5)
    fig.tight_layout()
    path = os.path.join(tempfile.gettempdir(), "plotpress_gallery_mesh_grid_lines.html")
    fig.save(path, interactive=True)
    return path


source_path = _build_source_html()
data = plotpress.load_data(source_path)
# A bare (non-Report) figure has no report-level title of its own, so it
# falls back to the same "Figure N" label a Report page would show it under.
fig_entry = data["Figure 1"]
axes_data = fig_entry["axes"]    # keyed by each panel's own title

# ---------------------------------------------------------------------------
# Slice every panel's mesh along x at the same fixed row -- one 1-D line per
# panel, replotted into a *rebuilt* 5x6 grid: figure_from_template() reads
# the source figure's own grid shape back out of fig_entry["template"], so
# nothing here has to already know it was 5x6 -- and each rebuilt panel
# already carries its own title (fontsize included), with no set_title()
# call needed on this side at all. tick_params() is a real, documented
# exception -- see figure_from_template()'s own docstring -- so it's the
# one decoration still re-applied by hand below.
# ---------------------------------------------------------------------------
ROW = 5   # a fixed y index, the same across every panel

fig, axes = plotpress.figure_from_template(fig_entry["template"])
for i, ax in enumerate(np.asarray(axes).ravel()):
    mesh = axes_data[f"panel {i}"]["meshes"][0]
    ax.plot(mesh["x"], mesh["z"][ROW, :], color="C0")
    ax.tick_params(labelsize=5)
fig.tight_layout()
Total running time of the script: (0 minutes 0.479 seconds)