Note
Go to the end to download the full example code.
Measurement-induced state transitions vs readout power and duration
Probability that a qubit is kicked out of its computational subspace during
its own dispersive readout, swept over readout drive power and the
measurement’s duration – the tune-up that sets an upper bound on readout
power well before dispersive-approximation validity or resonator punch-out
(Readout resonator punch-out) would otherwise suggest. Above a
critical photon number the resonator-qubit system can be driven through a
chain of avoided crossings with higher transmon levels, kicking the qubit
out of |0>/|1> altogether; below it, transitions are rare no matter
how long the measurement runs. That threshold shape – rare below a critical
power, common above it, and needing some exposure time to manifest even then
– is why operating power is chosen with real margin below where naive SNR
optimization (Single-shot readout fidelity optimization) alone would
place it.
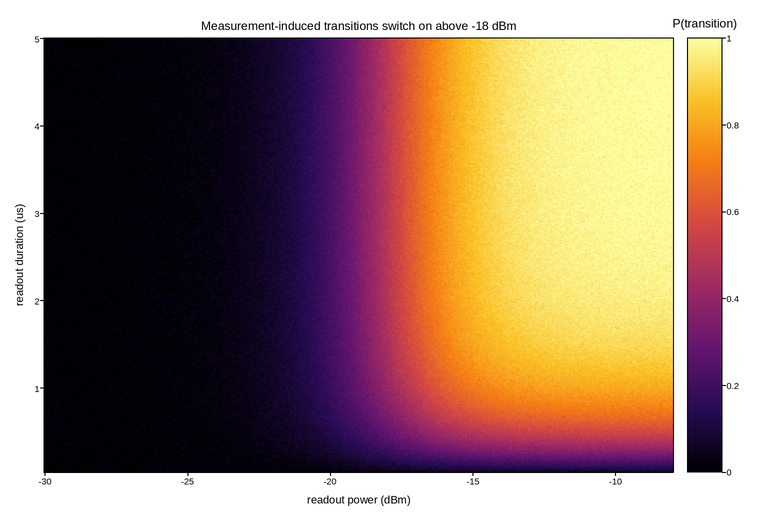
Live figure — pick a tool, then zoom, pan, point-pick or annotate. Nothing is active until a tool is selected.
View this figure’s Vega export ↗ — the raw JSON spec, rendered live by a real Vega engine.
View this figure’s Vega-Lite export ↗ — the raw JSON spec(s), rendered live by a real Vega-Lite engine.
import numpy as np
import polars as pl
import plotpress

P_CRIT = -18.0                 # dBm, critical readout power
WIDTH = 1.6                     # dB, threshold sharpness
T_RISE = 0.6                     # microseconds, exposure time to reach full probability
rng = np.random.default_rng(1102)

power = np.linspace(-30.0, -8.0, 320)      # dBm
duration = np.linspace(0.05, 5.0, 280)      # microseconds
P, T = np.meshgrid(power, duration)

threshold = 1.0 / (1.0 + np.exp(-(P - P_CRIT) / WIDTH))
exposure = 1.0 - np.exp(-T / T_RISE)
p_transition = threshold * exposure
p_transition += rng.normal(0.0, 0.012, p_transition.shape)
p_transition = np.clip(p_transition, 0.0, 1.0)

# One row per swept (power, duration) shot -- sorted before the reshape
# below so the pivot back to a grid is correct regardless of row order.
sweep = pl.DataFrame({
    "power_dbm": P.ravel(),
    "duration_us": T.ravel(),
    "p_transition": p_transition.ravel(),
}).sort(["duration_us", "power_dbm"])

power_axis = sweep["power_dbm"].unique().sort().to_numpy()
duration_axis = sweep["duration_us"].unique().sort().to_numpy()
p_transition = sweep["p_transition"].to_numpy().reshape(duration_axis.size, power_axis.size)

fig, ax = plotpress.subplots(figsize=(7.6, 5.2))
mesh = ax.pcolormesh(power_axis, duration_axis, p_transition, cmap="inferno", vmin=0.0, vmax=1.0)
bar = fig.colorbar(mesh, ax=ax)
bar.set_title("P(transition)")
ax.set_xlabel("readout power (dBm)")
ax.set_ylabel("readout duration (us)")
ax.set_title(f"Measurement-induced transitions switch on above {P_CRIT:.0f} dBm")
fig.tight_layout()
Total running time of the script: (0 minutes 0.293 seconds)