Note
Go to the end to download the full example code.
IQ mixer calibration: suppressing the image sideband
Image (unwanted) sideband power relative to the desired one, swept over the amplitude and phase correction applied to the I and Q baseband tones before upconversion – the second half of IQ mixer calibration, run after LO leakage is already nulled (IQ mixer calibration: nulling LO leakage). A perfectly balanced mixer needs equal I/Q amplitude and an exact 90-degree phase relationship to cancel the unwanted sideband through destructive interference; any gain or phase imbalance leaves a residual image tone at the mirrored frequency, which would otherwise drive the qubit (or leak into a neighbor’s readout) at an amplitude and phase nobody accounted for. The correction that minimizes it is read directly off the map’s minimum, the same way the LO-leakage null was – two mixer calibrations, two two-dimensional minimum searches, run back to back before any pulse on this line means what it is supposed to.
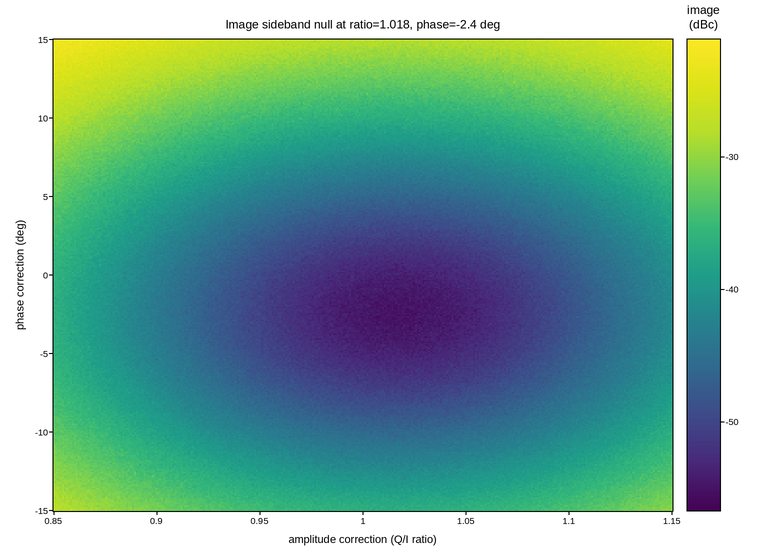
Live figure — pick a tool, then zoom, pan, point-pick or annotate. Nothing is active until a tool is selected.
View this figure’s Vega export ↗ — the raw JSON spec, rendered live by a real Vega engine.
View this figure’s Vega-Lite export ↗ — the raw JSON spec(s), rendered live by a real Vega-Lite engine.
import numpy as np
import polars as pl
import plotpress

AMP_CORR0 = 1.018              # correct amplitude ratio (Q/I)
PHASE_CORR0 = -2.4               # correct phase correction, degrees
SLOPE_DB = 42.0
NOISE_FLOOR_DBC = -55.0
rng = np.random.default_rng(1304)

amp_corr = np.linspace(0.85, 1.15, 320)
phase_corr = np.linspace(-15.0, 15.0, 300)      # degrees
AMP, PHASE = np.meshgrid(amp_corr, phase_corr)

residual = (AMP - AMP_CORR0) ** 2 / 0.02 ** 2 + (PHASE - PHASE_CORR0) ** 2 / 1.5 ** 2
image_dbc = NOISE_FLOOR_DBC + SLOPE_DB * np.log10(1.0 + residual / 40.0)
image_dbc += rng.normal(0.0, 0.5, image_dbc.shape)

# One row per swept (amplitude, phase) correction point -- sorted before
# the reshape below so the pivot back to a grid is correct regardless of
# row order.
sweep = pl.DataFrame({
    "amp_corr": AMP.ravel(),
    "phase_corr_deg": PHASE.ravel(),
    "image_dbc": image_dbc.ravel(),
}).sort(["phase_corr_deg", "amp_corr"])

amp_axis = sweep["amp_corr"].unique().sort().to_numpy()
phase_axis = sweep["phase_corr_deg"].unique().sort().to_numpy()
image_dbc = sweep["image_dbc"].to_numpy().reshape(phase_axis.size, amp_axis.size)

fig, ax = plotpress.subplots(figsize=(7.6, 5.6))
mesh = ax.pcolormesh(amp_axis, phase_axis, image_dbc, cmap="viridis")
bar = fig.colorbar(mesh, ax=ax)
bar.set_title("image\n(dBc)")
ax.set_xlabel("amplitude correction (Q/I ratio)")
ax.set_ylabel("phase correction (deg)")
ax.set_title(f"Image sideband null at ratio={AMP_CORR0:.3f}, phase={PHASE_CORR0:.1f} deg")
fig.tight_layout()
Total running time of the script: (0 minutes 0.326 seconds)