Note
Go to the end to download the full example code.
An ECG monitor sweep, drawing left to right
The same six-second rhythm strip as ECG rhythm strip with beat annotations, drawn the way a bedside monitor actually renders it: a trace sweeping left to right across a fixed window, each beat appearing only once the sweep reaches it. A monitor does not show the whole strip instantly and it does not scroll – it draws, the same progressive reveal used for a live control chart (A control chart, revealed subgroup by subgroup) and a live training run (A training run, revealed epoch by epoch), just at ECG speed instead of theirs.
The premature beat is the reason this view matters clinically, not only visually. On a finished static strip it is one odd complex among many, already contextualized by everything before and after it. Watching the sweep reach it – no P wave, a QRS shaped wrong, arriving early – is closer to how it is actually caught at the bedside: a single beat that looks wrong the instant it is drawn, followed by the pause while the rhythm resets, rather than a pattern spotted by scanning a completed printout.
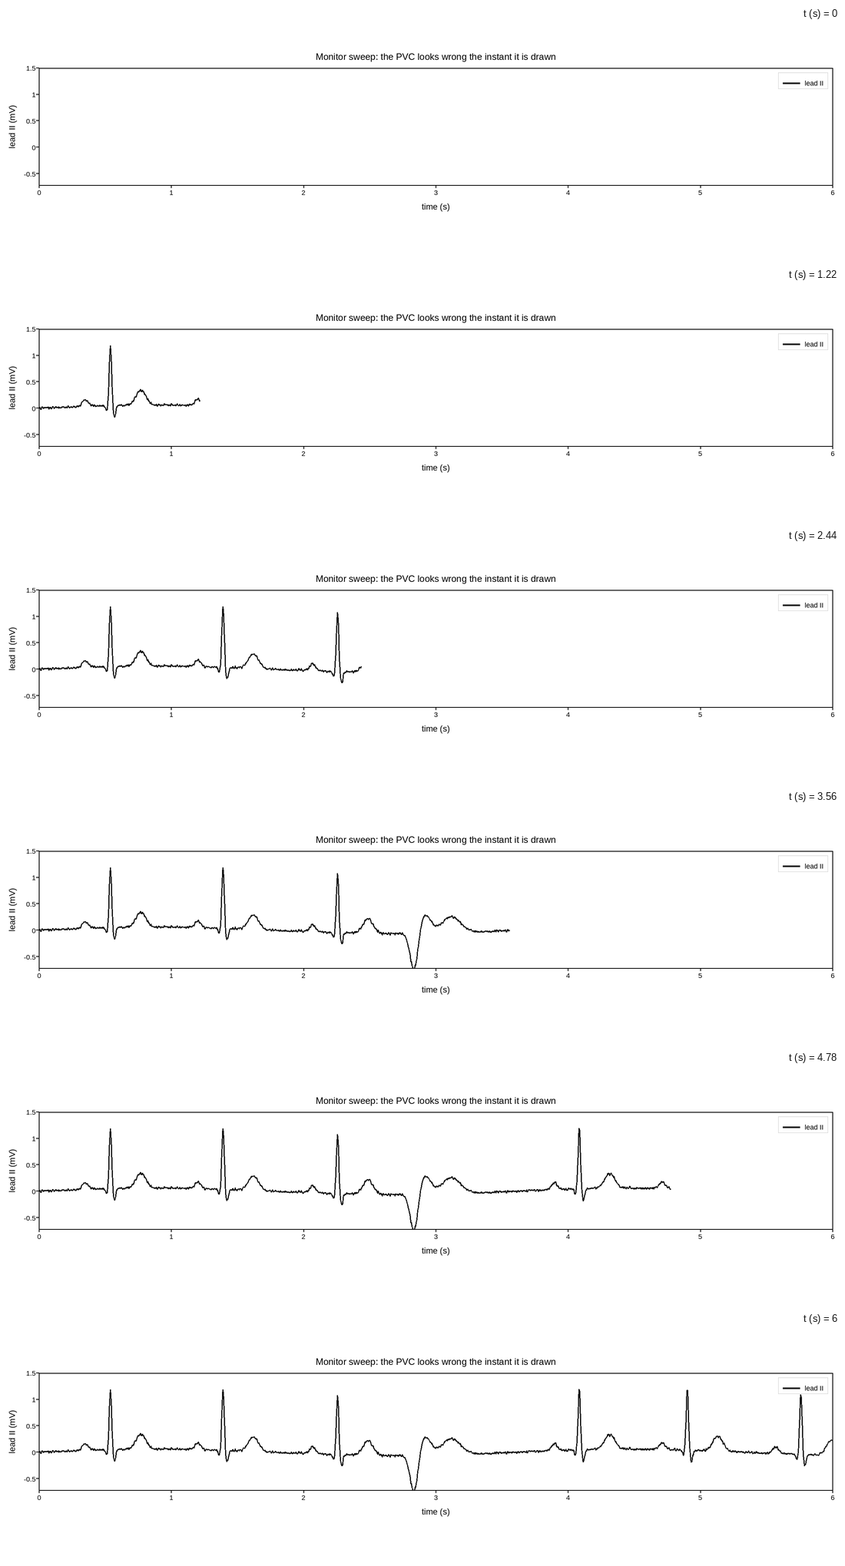
Live figure — pick a tool, then zoom, pan, point-pick or annotate. Nothing is active until a tool is selected.
import os
import tempfile

import numpy as np
import plotpress

rng = np.random.default_rng(60)

FS = 250.0                                          # samples per second
DURATION = 6.0
t = np.arange(0.0, DURATION, 1.0 / FS)


def gaussian(t, centre, amp, width):
    return amp * np.exp(-((t - centre) ** 2) / (2.0 * width ** 2))


def normal_beat(t, onset):
    return (gaussian(t, onset + 0.00, 0.13, 0.022)
            + gaussian(t, onset + 0.16, -0.10, 0.008)
            + gaussian(t, onset + 0.19, 1.15, 0.009)
            + gaussian(t, onset + 0.22, -0.22, 0.010)
            + gaussian(t, onset + 0.42, 0.28, 0.038))


def ectopic_beat(t, onset):
    return (gaussian(t, onset + 0.18, -0.75, 0.030)
            + gaussian(t, onset + 0.26, 0.35, 0.045)
            + gaussian(t, onset + 0.46, 0.30, 0.070))


onsets, kinds, clock = [], [], 0.35
while clock < DURATION - 0.6:
    onsets.append(clock)
    kinds.append("N")
    clock += 0.833 + 0.035 * np.sin(2 * np.pi * clock / 4.0)
onsets[3], kinds[3] = onsets[3] - 0.24, "V"
for i in range(4, len(onsets)):
    onsets[i] += 0.20

ecg = np.zeros_like(t)
for onset, kind in zip(onsets, kinds):
    ecg += (ectopic_beat if kind == "V" else normal_beat)(t, onset)
ecg += 0.06 * np.sin(2 * np.pi * 0.28 * t)
ecg += 0.008 * np.sin(2 * np.pi * 50.0 * t)
ecg += rng.normal(0.0, 0.011, t.size)

n = t.size
N_FRAMES = 60
checkpoints = np.linspace(0, n - 1, N_FRAMES).astype(int)
revealed = np.full((N_FRAMES, n), np.nan)
for f, stop in enumerate(checkpoints):
    revealed[f, :stop + 1] = ecg[:stop + 1]

fig, ax = plotpress.subplots(figsize=(11.0, 3.4))
ax.plot_frames(t, revealed, slider_values=t[checkpoints], slider_label="t (s)",
              color="#111111", label="lead II")
ax.set_aspect(0.4)                                  # ECG paper convention: 25 mm/s, 10 mm/mV
ax.set_xlim(0.0, DURATION)
ax.set_ylim(-0.72, 1.50)
ax.set_xlabel("time (s)")
ax.set_ylabel("lead II (mV)")
ax.set_title("Monitor sweep: the PVC looks wrong the instant it is drawn")
ax.legend(loc="upper right")
fig.tight_layout()

gif_path = os.path.join(tempfile.gettempdir(), "plotpress_ecg_monitor_sweep.gif")
fig.save(gif_path, fps=15)
Total running time of the script: (0 minutes 7.871 seconds)