Note
Go to the end to download the full example code.
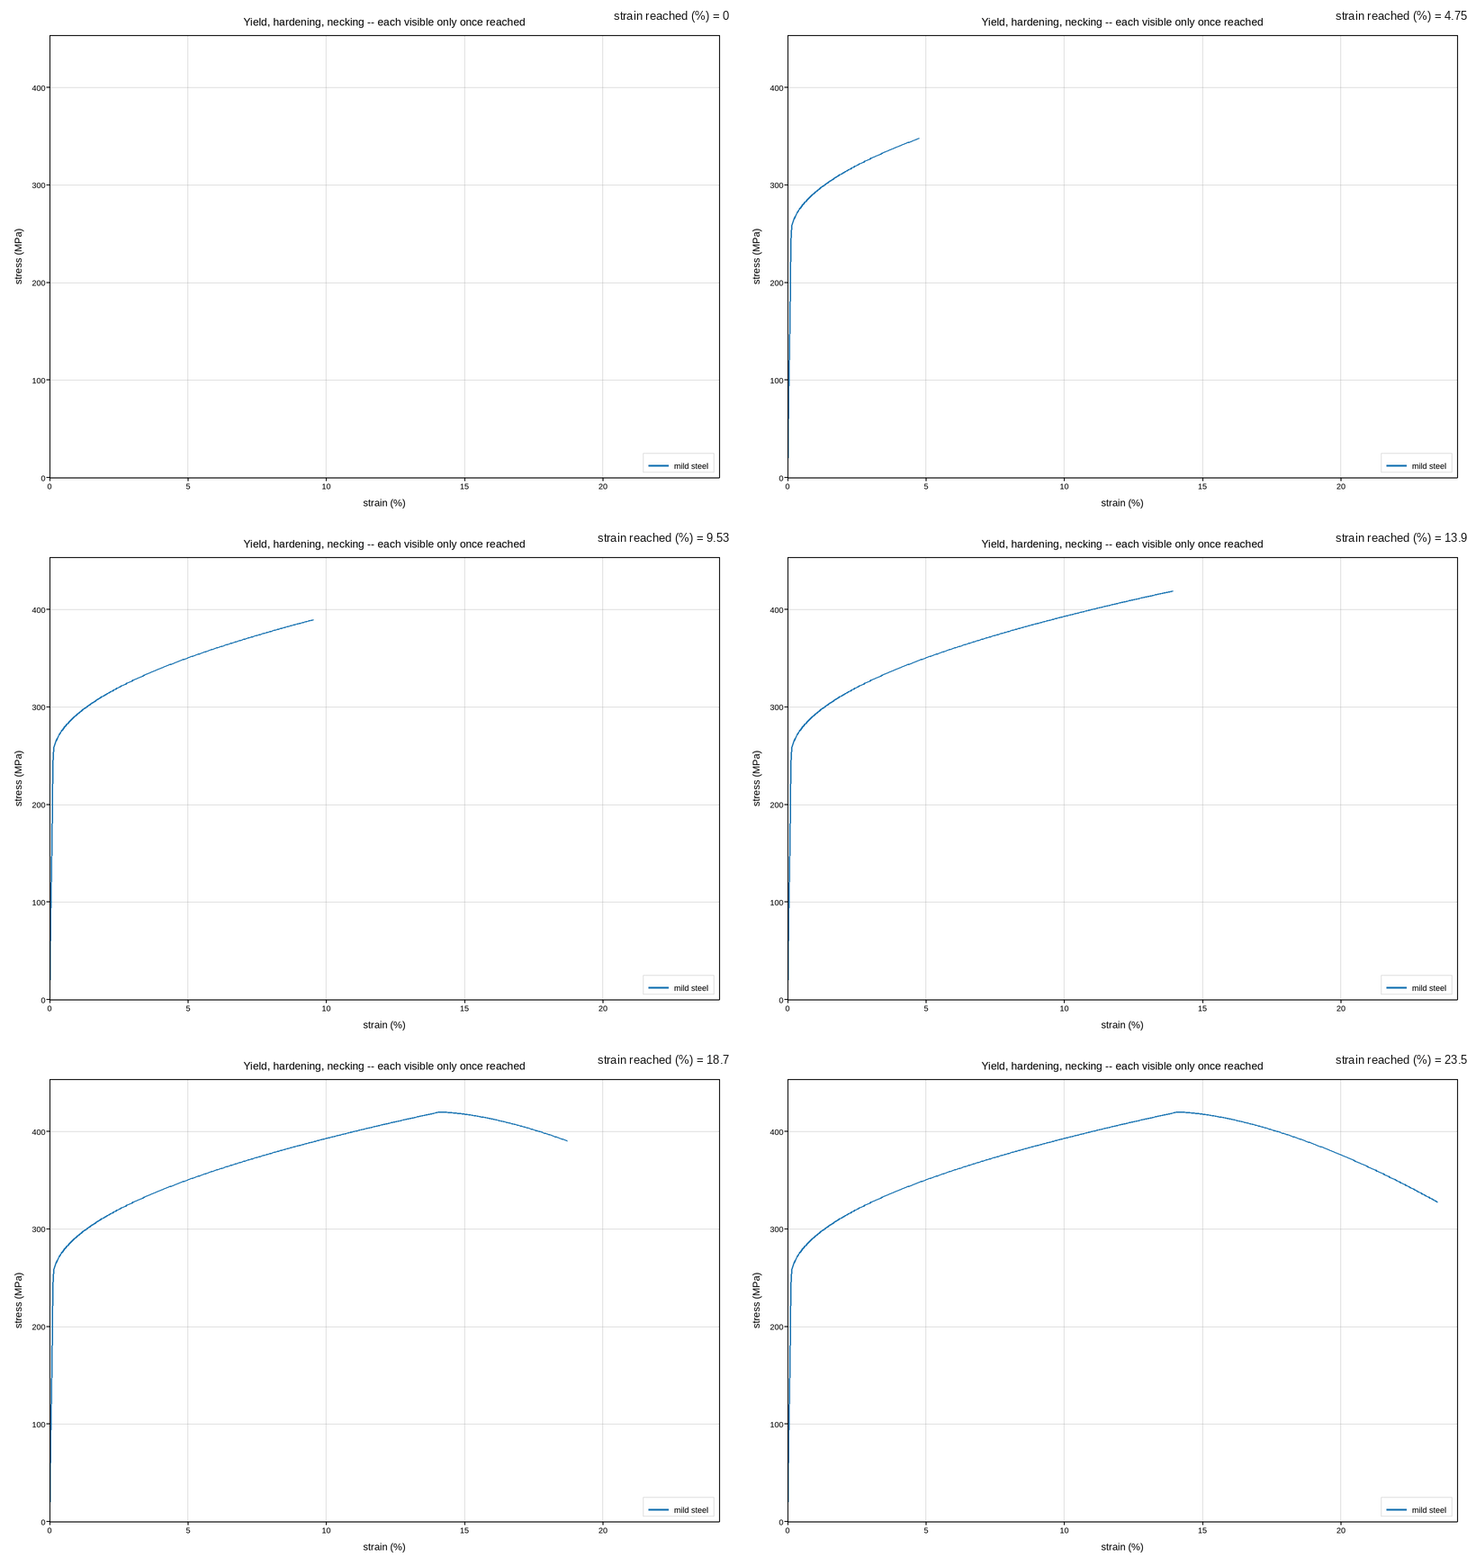
A tensile test, loaded in real time
The mild-steel curve from Tensile test: engineering and true stress, revealed the way a
tensile testing machine’s own strain gauge and load cell report it: point by
point as the crosshead moves, not as a finished curve. The same
progressive-reveal technique used for a live control chart
(A control chart, revealed subgroup by subgroup) and a live training run
(A training run, revealed epoch by epoch) applies to a mechanical
test just as well – unrevealed strain is held at nan rather than the
line jumping ahead of the crosshead.
Three landmarks appear only once the specimen has actually reached them, not before, which is the honest version of a plot most textbook figures show fully formed: the elastic line is straight until it visibly is not (yield), the curve keeps climbing well past that point (strain hardening, not immediate failure), and stress falls while strain keeps rising in the final stretch – necking, engineering stress measured against the original area even as the true cross-section is shrinking fast.
Live figure — pick a tool, then zoom, pan, point-pick or annotate. Nothing is active until a tool is selected.
import os
import tempfile

import numpy as np
import plotpress


def curve(E_gpa, yield_mpa, uts_mpa, eps_f, n=600):
    """Linear elastic to yield, then Hollomon power-law hardening to the UTS."""
    eps = np.linspace(0.0, eps_f, n)
    E = E_gpa * 1e3
    eps_y = yield_mpa / E
    plastic = np.clip(eps - eps_y, 0.0, None)
    eps_u = 0.6 * eps_f
    hardening = uts_mpa - yield_mpa
    sigma = yield_mpa + hardening * np.clip(plastic / (eps_u - eps_y), 0, 1) ** 0.5
    sigma = np.where(eps < eps_y, E * eps, sigma)
    neck = np.clip((eps - eps_u) / (eps_f - eps_u), 0.0, 1.0)
    return eps, sigma * (1.0 - 0.22 * neck ** 1.6)


eps, sigma = curve(205, 250, 420, 0.235)             # mild steel
n = eps.size

N_FRAMES = 60
checkpoints = np.linspace(0, n - 1, N_FRAMES).astype(int)
revealed = np.full((N_FRAMES, n), np.nan)
for f, stop in enumerate(checkpoints):
    revealed[f, :stop + 1] = sigma[:stop + 1]

fig, ax = plotpress.subplots(figsize=(8.2, 5.8))
ax.plot_frames(eps * 1e2, revealed, slider_values=eps[checkpoints] * 1e2,
              slider_label="strain reached (%)", color="#1f77b4",
              label="mild steel")
ax.set_xlim(0.0, eps.max() * 1e2 * 1.03)
ax.set_ylim(0.0, sigma.max() * 1.08)
ax.set_xlabel("strain (%)")
ax.set_ylabel("stress (MPa)")
ax.set_title("Yield, hardening, necking -- each visible only once reached")
ax.legend(loc="lower right")
ax.grid(True)
fig.tight_layout()

gif_path = os.path.join(tempfile.gettempdir(), "plotpress_tensile_test_live.gif")
fig.save(gif_path, fps=12)
Total running time of the script: (0 minutes 10.938 seconds)