Note
Go to the end to download the full example code.
Single-shot readout IQ blob histogram
A two-dimensional histogram of single-shot demodulated readout points, one
per measurement, for a qubit prepared equally often in |0> and |1> –
the calibration plot that sets the demodulation angle and the discrimination
threshold for every single-shot measurement afterward. Each state’s cloud of
points is approximately Gaussian, centered where that state’s dispersive
response places it in the IQ plane and spread by the same amplifier and
thermal noise regardless of which state produced it; the separation between
the two clouds relative to their common spread is exactly the SNR that sets
assignment fidelity (compare the frequency/duration optimization in
Single-shot readout fidelity optimization). Rotating the demodulation
phase so the line joining the two blob centers lies along the I axis is what
lets a single-quadrature threshold on I alone separate the states, instead
of a threshold in the full IQ plane.
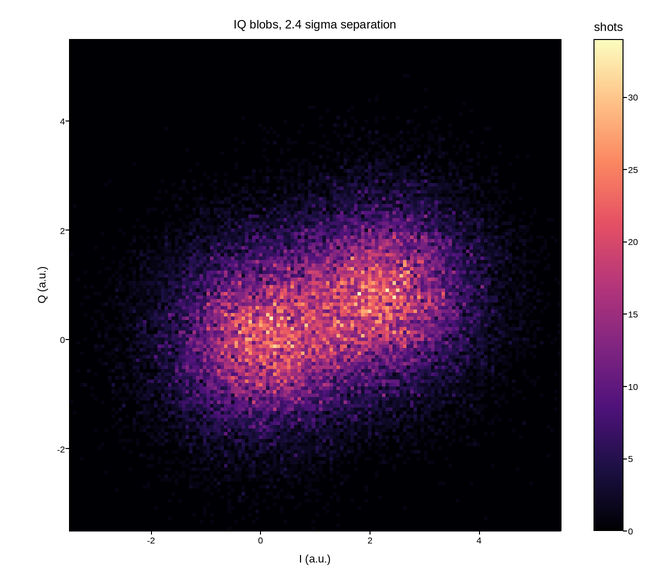
Live figure — pick a tool, then zoom, pan, point-pick or annotate. Nothing is active until a tool is selected.
View this figure’s Vega export ↗ — the raw JSON spec, rendered live by a real Vega engine.
View this figure’s Vega-Lite export ↗ — the raw JSON spec(s), rendered live by a real Vega-Lite engine.
import numpy as np
import polars as pl
import plotpress

N_SHOTS = 60000
SEPARATION = 2.4               # blob center-to-center distance, in noise sigmas
rng = np.random.default_rng(808)

state = rng.integers(0, 2, N_SHOTS)          # 0 or 1, equally likely
angle = 0.35                                   # readout IQ angle, radians
center_g = np.array([0.0, 0.0])
center_e = SEPARATION * np.array([np.cos(angle), np.sin(angle)])

points = np.where(state[:, None] == 0, center_g, center_e)
points = points + rng.normal(0.0, 1.0, points.shape)

# One row per single-shot measurement -- exactly the raw shot table a real
# acquisition would log, before it is ever binned into a histogram.
shots = pl.DataFrame({
    "state": state,
    "i": points[:, 0],
    "q": points[:, 1],
})

counts, i_edges, q_edges = np.histogram2d(
    shots["i"].to_numpy(), shots["q"].to_numpy(), bins=140,
    range=[[-3.5, 5.5], [-3.5, 5.5]])

fig, ax = plotpress.subplots(figsize=(6.6, 5.8))
mesh = ax.pcolormesh(i_edges, q_edges, counts.T, cmap="magma")
bar = fig.colorbar(mesh, ax=ax)
bar.set_title("shots")
ax.set_aspect("equal")
ax.set_xlabel("I (a.u.)")
ax.set_ylabel("Q (a.u.)")
ax.set_title(f"IQ blobs, {SEPARATION:.1f} sigma separation")
fig.tight_layout()
Total running time of the script: (0 minutes 0.153 seconds)