Note
Go to the end to download the full example code.
Active reset calibration: residual excitation vs rounds and pulse amplitude
Post-reset excited-state population from an iterative measurement-based reset – measure, and conditionally apply a pi pulse if found excited – swept over how many rounds are run and the conditional pulse’s amplitude scale factor. Each round leaves behind a small residual population set by how well-calibrated the conditional pulse is, roughly parabolic around the correct amplitude; running another round multiplies that residual down again, so the population left behind falls exponentially with the number of rounds, not linearly. That is precisely why so few rounds already reach a population an order of magnitude below where a single measure-and-flip attempt would land – and why the residual is plotted on a log scale here: a linear one would show every round past the second or third as indistinguishable from zero.
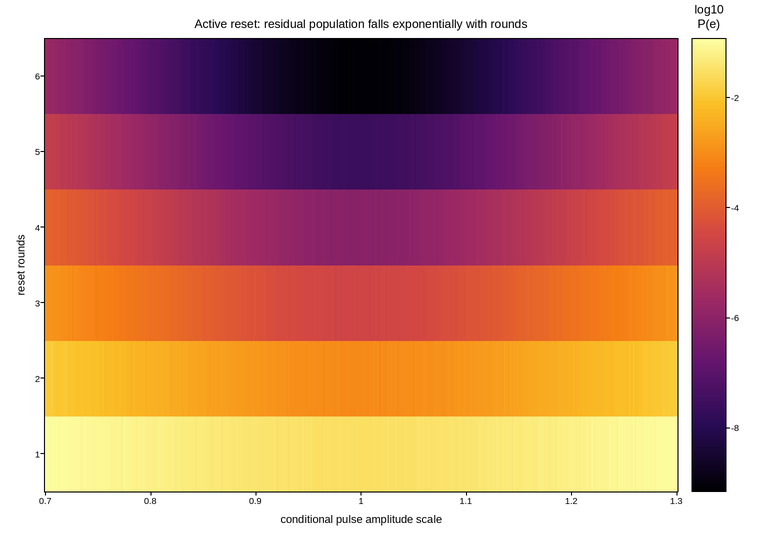
Live figure — pick a tool, then zoom, pan, point-pick or annotate. Nothing is active until a tool is selected.
View this figure’s Vega export ↗ — the raw JSON spec, rendered live by a real Vega engine.
View this figure’s Vega-Lite export ↗ — the raw JSON spec(s), rendered live by a real Vega-Lite engine.
import numpy as np
import polars as pl
import plotpress

BASE_LEAK = 0.03               # per-round residual excitation at the correct amplitude
CURVATURE = 0.9                 # sets how fast per-round leakage grows off-amplitude
N_MAX = 6
rng = np.random.default_rng(626)

amp_scale = np.linspace(0.7, 1.3, 320)
rounds = np.arange(1, N_MAX + 1)
AMP, N = np.meshgrid(amp_scale, rounds)

leak_per_round = BASE_LEAK + CURVATURE * (AMP - 1.0) ** 2
residual = np.clip(leak_per_round, 1e-4, 1.0) ** N
residual *= 1.0 + rng.normal(0.0, 0.05, residual.shape)
residual = np.clip(residual, 1e-12, 1.0)

# One row per swept (amplitude scale, rounds) shot -- sorted before the
# reshape below so the pivot back to a grid is correct regardless of order.
sweep = pl.DataFrame({
    "amp_scale": AMP.ravel(),
    "rounds": N.ravel(),
    "log_residual": np.log10(residual).ravel(),
}).sort(["rounds", "amp_scale"])

amp_axis = sweep["amp_scale"].unique().sort().to_numpy()
rounds_axis = sweep["rounds"].unique().sort().to_numpy()
log_residual = sweep["log_residual"].to_numpy().reshape(rounds_axis.size, amp_axis.size)

fig, ax = plotpress.subplots(figsize=(7.6, 5.4))
mesh = ax.pcolormesh(amp_axis, rounds_axis, log_residual, cmap="inferno")
bar = fig.colorbar(mesh, ax=ax)
bar.set_title("log10\nP(e)")
ax.set_xlabel("conditional pulse amplitude scale")
ax.set_ylabel("reset rounds")
ax.set_title("Active reset: residual population falls exponentially with rounds")
fig.tight_layout()
Total running time of the script: (0 minutes 0.175 seconds)