Note
Go to the end to download the full example code.
SQUID switching-current probability vs flux
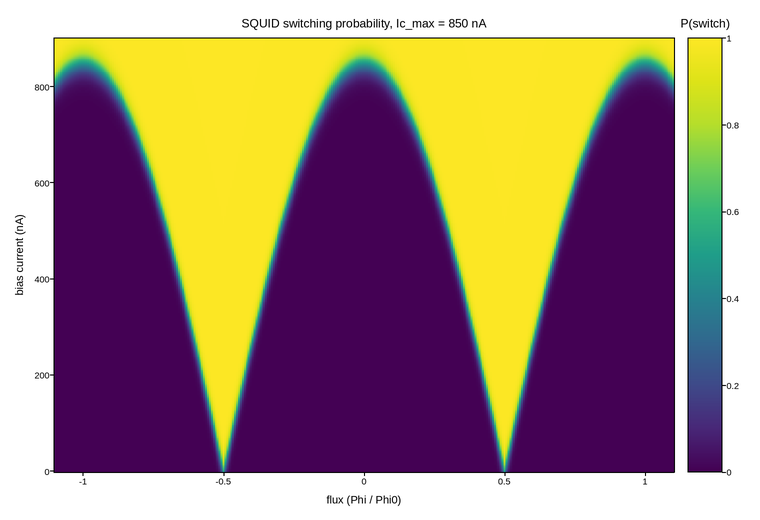
Switching probability of a DC SQUID from the zero-voltage (supercurrent)
state to the resistive state, swept over an increasing bias current and
applied flux, built from many repeated bias ramps per flux point. A single
ramp switches at some current close to the SQUID’s critical current, but not
exactly there and not at the same value twice – escape from the zero-voltage
state is a thermally (or, at low enough temperature, quantum-mechanically)
activated stochastic process, so it is the probability of having switched
by a given bias that is actually measured, not a sharp threshold. Two-junction
interference makes the critical current itself periodic in flux,
Ic(Phi) = Ic_max |cos(pi Phi / Phi0)|, which is what traces out the
scalloped switching-probability boundary here rather than a flat line.
The quantity being plotted is a probability with fixed limits, the same
convention Qubit Rabi chevron uses – pinning vmin=0/vmax=1
rather than autoscaling keeps that boundary’s steepness comparable across
figures instead of depending on whatever range a given sweep happened to
cover.
Live figure — pick a tool, then zoom, pan, point-pick or annotate. Nothing is active until a tool is selected.
View this figure’s Vega export ↗ — the raw JSON spec, rendered live by a real Vega engine.
View this figure’s Vega-Lite export ↗ — the raw JSON spec(s), rendered live by a real Vega-Lite engine.
import numpy as np
import polars as pl
import plotpress

IC_MAX = 850.0                # peak critical current, nA
SWITCH_WIDTH = 14.0            # nA, thermal/quantum switching width

flux = np.linspace(-1.1, 1.1, 320)          # Phi / Phi0
bias = np.linspace(0.0, 900.0, 300)          # nA
PHI, I = np.meshgrid(flux, bias)

ic = IC_MAX * np.abs(np.cos(np.pi * PHI))
p_switch = 1.0 / (1.0 + np.exp(-(I - ic) / SWITCH_WIDTH))

# One row per swept (flux, bias) point -- sorted before the reshape below so
# the pivot back to a grid is correct regardless of row order.
sweep = pl.DataFrame({
    "flux_phi0": PHI.ravel(),
    "bias_na": I.ravel(),
    "p_switch": p_switch.ravel(),
}).sort(["bias_na", "flux_phi0"])

flux_axis = sweep["flux_phi0"].unique().sort().to_numpy()
bias_axis = sweep["bias_na"].unique().sort().to_numpy()
p_switch = sweep["p_switch"].to_numpy().reshape(bias_axis.size, flux_axis.size)

fig, ax = plotpress.subplots(figsize=(7.6, 5.2))
mesh = ax.pcolormesh(flux_axis, bias_axis, p_switch, cmap="viridis", vmin=0.0, vmax=1.0)
bar = fig.colorbar(mesh, ax=ax)
bar.set_title("P(switch)")
ax.set_xlabel("flux (Phi / Phi0)")
ax.set_ylabel("bias current (nA)")
ax.set_title(f"SQUID switching probability, Ic_max = {IC_MAX:.0f} nA")
fig.tight_layout()
Total running time of the script: (0 minutes 0.215 seconds)