Note
Go to the end to download the full example code.
The zonal-mean seasonal cycle, animated month by month
The surface counterpart of Zonal-mean atmospheric temperature’s vertical cross-section: zonal-mean surface temperature against latitude, stepped through the twelve months of the year. A single annual-mean curve is the right summary for climate; it is the wrong one for the seasonal cycle itself, which is a genuinely different curve every month and whose defining feature – how much the two hemispheres disagree about which month is warmest – only shows up by watching the curve rock back and forth.
The seasonal swing is not uniform across latitude, and that unevenness is the content. Near the equator the sun’s elevation barely changes over the year, so the curve there stays almost still; toward the poles the swing grows to tens of degrees, so the animation’s fastest-moving parts are its edges. The two hemispheres are exactly out of phase – July is northern summer and southern winter at once – which is why the curve does not simply rise and fall in place but rotates, warming on one side while cooling on the other.
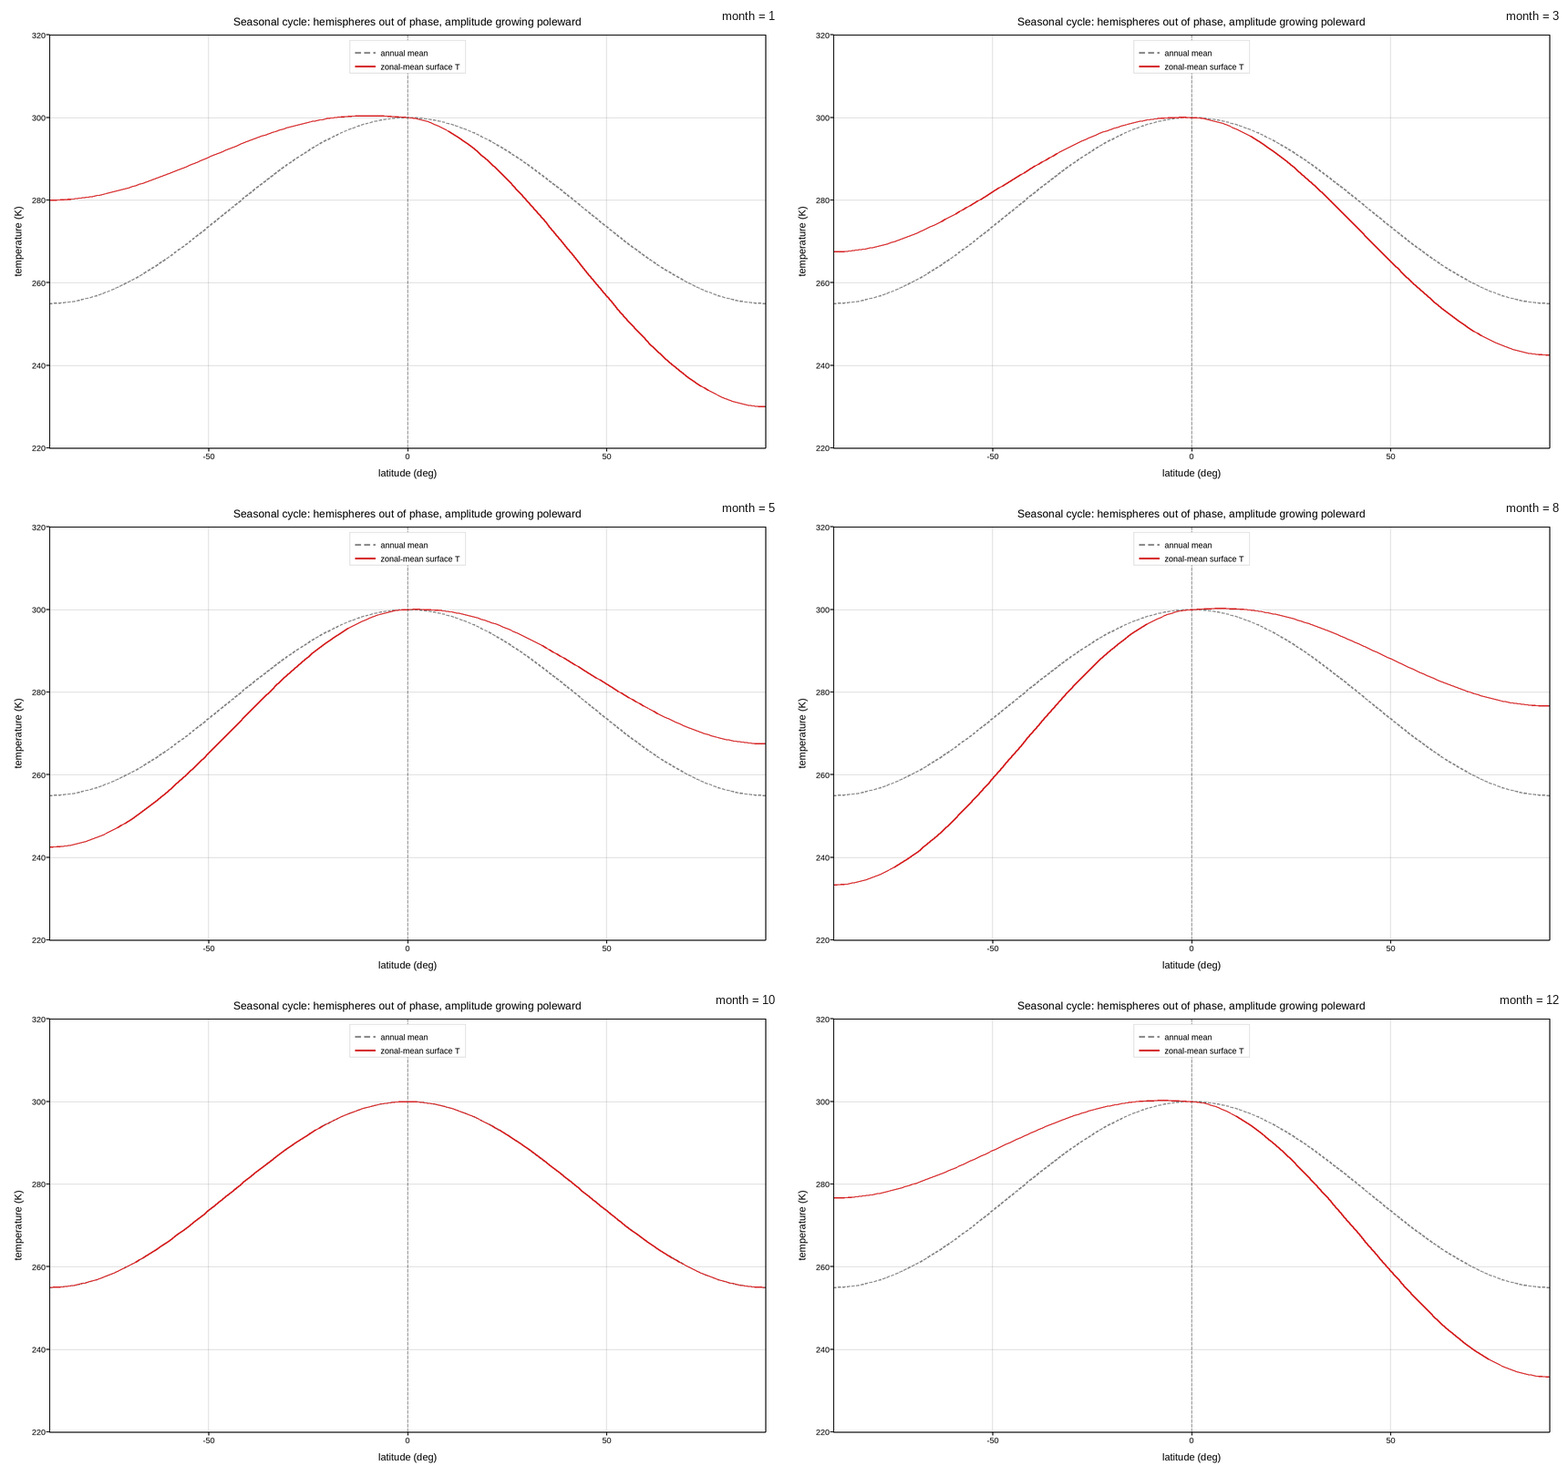
Live figure — pick a tool, then zoom, pan, point-pick or annotate. Nothing is active until a tool is selected.
View this figure’s Vega export ↗ — the raw JSON spec, rendered live by a real Vega engine.
View this figure’s Vega-Lite export ↗ — the raw JSON spec(s), rendered live by a real Vega-Lite engine.
import os
import tempfile

import numpy as np
import plotpress

lat = np.linspace(-90.0, 90.0, 200)                 # degrees

T_ANNUAL = 300.0 - 45.0 * np.sin(np.radians(np.abs(lat))) ** 2

# Seasonal amplitude grows toward the poles and nearly vanishes at the
# equator, where the sun's elevation barely changes over the year.
AMPLITUDE = 25.0 * np.sin(np.radians(np.abs(lat))) ** 1.5
HEMISPHERE_SIGN = np.sign(lat)
HEMISPHERE_SIGN[HEMISPHERE_SIGN == 0.0] = 1.0        # the equator itself, arbitrarily

month = np.arange(1, 13)

# Phased so July peaks in the north (summer there) and troughs in the south
# (winter there) at the same instant -- the two hemispheres share a
# calendar but disagree about what it means.
phase = np.cos(2.0 * np.pi * (month[:, None] - 7.0) / 12.0)
temperature = T_ANNUAL[None, :] + AMPLITUDE[None, :] * HEMISPHERE_SIGN[None, :] * phase

fig, ax = plotpress.subplots(figsize=(8.6, 5.4))
ax.plot(lat, T_ANNUAL, color="#888888", linestyle="--", linewidth=1.3,
        label="annual mean")
ax.plot_frames(lat, temperature, slider_values=month, slider_label="month",
              color="#d62728", label="zonal-mean surface T")
ax.axvline(0.0, color="#333333", linewidth=0.7)
ax.set_ylim(220.0, 320.0)
ax.set_xlim(-90.0, 90.0)
ax.set_xlabel("latitude (deg)")
ax.set_ylabel("temperature (K)")
ax.set_title("Seasonal cycle: hemispheres out of phase, amplitude growing poleward")
ax.legend(loc="upper center")
ax.grid(True)
fig.tight_layout()

gif_path = os.path.join(tempfile.gettempdir(), "plotpress_seasonal_cycle.gif")
fig.save(gif_path, fps=4)
Total running time of the script: (0 minutes 3.321 seconds)